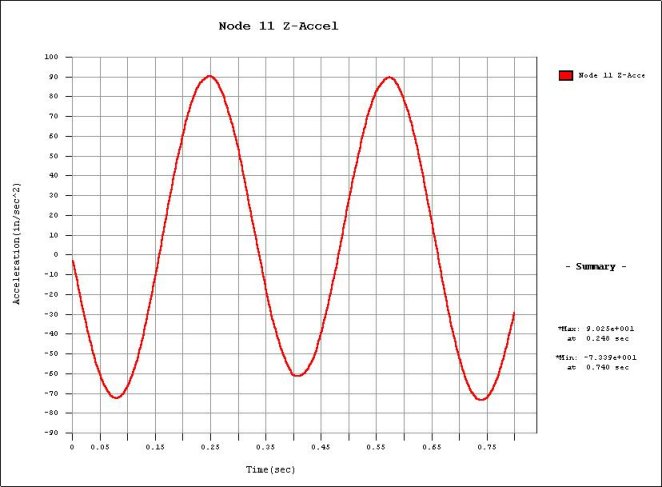
Time History Graph
Plot graphs for time history analysis results vs. time. The results include displacements and member forces/stresses of truss/beam elements. For boundary nonlinear analysis, nodal displacements of nonlinear link elements can be plotted.
From the Main Menu select Results > Time History > T.H Graph/Text > Time History Graph.
|
 Type of Display
Enter a title of the time history graph and a format of output for axes.
Graph Title: Title of time history graph
X Axis Deci. Pt. (Exp): Decimal points and whether to express in exponents for X-axis of the graph
Y Axis Deci. Pt. (Exp): Decimal points and whether to express in exponents for Y-axis of the graph
Type
Select a graph type
Time History Graph: Time History Graph representing analysis results.
Modal Max Graph: Frequency time history graphs representing the maximum values of individual modes.
Serviceability Check Graph: When the serviceability of floor vibration is to be evaluated, a comparative graph is presented to assess the acceptability against the Japanese Regulation for serviceability performance evaluation.
Note
If Serviceability Check Graph is selected, the results are plotted against the standards for serviceability evaluation, using the maximum values and the predominant frequency obtained from the time history analysis.
![]() : Display graphs for the selected functions defined in the Check Functions to Plot list.
: Display graphs for the selected functions defined in the Check Functions to Plot list.
|
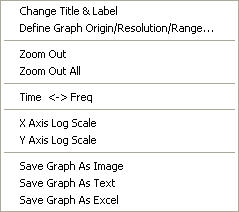
Right click on the graph displayed on the screen to prompt the following Context Menu. |
|
|
|
Change Title & Label Define Graph Origin/Resolution/Range... Zoom Out Zoom Out All Time <-> Freq X Axis Log Scale Y Axis Log Scale Save Graph As Image Save Graph As Text Save Graph As Exel |