Deformed Shape
Check the Deformed Shape of the model.
When the pushover analysis or the time history analysis is completed, check the deformed shape of the model for each time step.
Note
When the pushover analysis is carried out using the inelastic general link elements (Spring Type), the yield status of the general link elements are displayed in the Legend along with the percentage of the hinge status level.
From the Main Menu select Results > Results > Deformations > Deformed Shape.
|
 Components
Select the desired deformation component among the following:
DX: Displacement component in GCS X-direction
DY: Displacement component in GCS Y-direction
DZ: Displacement component in GCS Z-direction
DXY = ![]()
DYZ = ![]()
DXZ = ![]()
DXYZ = ![]()
Local (if defined) : Where nodes are defined with local coordinate systems, displacements are produced with respect to the local coordinate systems.
Type of Display
Assign the type of display as follows:
|
Deform |
Display the deformed shape of the model. |
|
|
Deformation Scale Factor Deformation Type Nodal Deform: Display the deformed shape representing only the nodal displacements. Real Displacement (Auto-Scale off): The true deformation of the structure is graphically represented without magnifying or reducing it. This option is typically used for geometric nonlinear analysis reflecting large displacement. Relative Displacement: The deformation of the structure is graphically represented relative to the minimum nodal displacement, which is set to "0" |
|
Undeformed |
Overlap the undeformed and deformed shapes of the model. |
|
Values |
Display the nodal displacements in numerical values. |
|
|
Decimal Points: Assign decimal points for the displayed numbers Min & Max: Display the maximum and minimum values Set Orientation: Display orientation of numerical values Note |
|
Display various references related to analysis results to the right or left of the working window. |
|
|
|
Legend Position: Position of the legend in the display window Rank Value Type: Specify a type of values in the Legend and the number of decimal points. |
|
Animate |
Dynamically simulate the transition process. |
|
|
Animation Mode: Determine the type of animation for analysis results. Animate Contour: Option to change the color of the contour representing the transition according to the magnitudes of variation Note AVI Options: Enter the options required to produce the animation window. Bits per Pixel: Number of bits per pixel to create the default window for animation Stage Animation: Animations by construction stages |
|
Mirrored
|
"Mirrored" allows the user to expand the analysis results obtained from a half or quarter model into the results for the full model by reflecting planes. Half Model Mirroring |
|
Hinge Status |
The status of hinges formed by Pushover analysis is produced. |
|
Current Step Disp. |
Produce the displacements pertaining to the selected step of the construction stage if a construction stage analysis has been performed. |
|
Stage/Step Real |
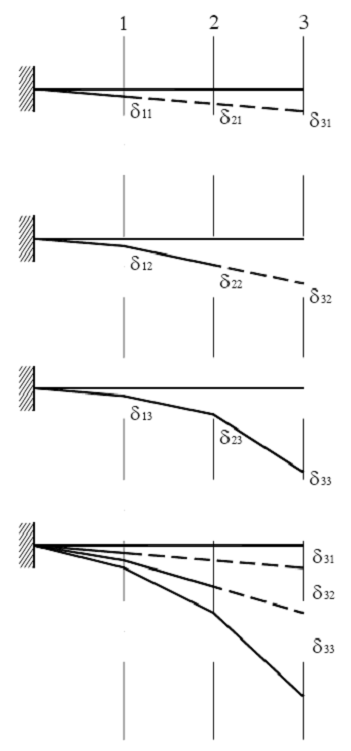
Display the Real Displacements for each construction stage when the construction stage analysis is performed. Note Real displacement is relevant only for construction stage analysis. To illustrate real displacement, a cantilever is constructed in 3 stages as shown below. Node 3 is activated at the stage 3, and the deflection δ33 occurs due to the self weight of the segment 3. But when constructing steel girders or PC girders, the virtual displacements δ31 and δ32 occur at the stage 1 and stage 2 respectively. Real displacement is the summation of virtual displacements, which occur before the corresponding node is even activated and net displacement, which occurs after the node is activated. Real displacement corresponds to the fabrication camber.
|
![]() New for Civil 2010
New for Civil 2010
|
Pushover Hinge |
Hinge status: The status of hinges formed by pushover analysis is produced. Element Yield Status: The yield status of components (Fx, Fy & Fz, Mx, and My & Mz) by pushover analysis is produced. This option is useful in verifying if a shear failure occurred in any element.
|
Note. Checking the Pushover Analysis Results
Batch Output Generation ( .jpg) ,
, .jpg) )
)
Given the types of analysis results for Graphic outputs, generate consecutively graphic outputs for selected load cases and combinations. A total number of files equal to the products of the numbers of checked items in the three columns of the dialog box below are created. (Details...)