Analysis Result of Fiber Section
Analysis results of fiber sections from time history analysis are displayed. The results consist of member force history of inelastic beam members modeled with fiber elements, stress - strain results of each section cell, and the state of fibers.
From the Main Menu select Results > Time History > T.H Results > Analysis Result of Fiber Section
![]() Element
Element
Enter a beam element number modeled with fibers. Analysis results of the fiber model defined within the element are produced.
![]() Load case
Load case
Select a time history analysis case defined in Time History Load Cases.
![]() Object for Plotting
Object for Plotting
Section: Plot the analysis results of the entire section of the selected element.
Fiber: Plot the analysis results of each cell of the selected element.
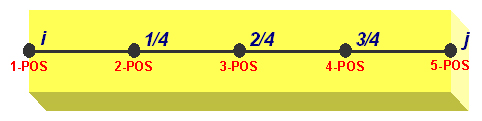
Position: Select the positions in the element local x-direction where the results are required. 5 Positions including i and j ends can be selected as shown in the following figure.
![]() Type of Graph
Type of Graph
Define the types of X and Y axis of the results output.
If Section is selected
X-axis can be defined for Dx, Ry, Rz, Fx, My, Mz, and Time. Y-axis can be defined for Dx, Ry, Rz, Fx, My and Mz. For 6 most frequently used combinations of components, selection can be made by the use of the buttons provided.
|
Dx-Fx: Deformation - Axial force in the ECS x-axis direction My-Fx: Moment about the ECS y-axis - Axial force in the ECS x-axis direction Ry-My: Curvature about the ECS y-axis - Moment about the ECS y-axis Mz-Fx: Moment about the ECS z-axis - Axial force in the ECS x-axis direction Rz-Mz: Curvature about the ECS z-axis - Moment about the ECS z-axis My-Mz: Moment about the ECS y-axis - Moment about the ECS z-axis |
If Fiber is selected
|
Time: Time SN: Strain SS: Stress |
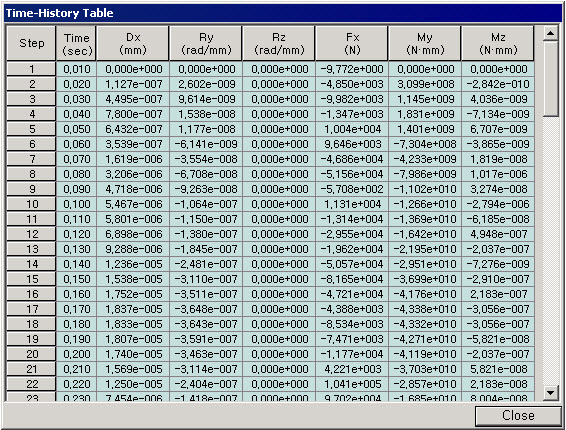
Plot Table: Generate the time history analysis results in a table format.
![]() : Display the graph based on the assigned axes.
: Display the graph based on the assigned axes.
![]() : Select cells.
: Select cells.
![]() : Unselect all the selected cells.
: Unselect all the selected cells.
![]() : Display all the cells.
: Display all the cells.
![]() : Zoom the selected screen display
: Zoom the selected screen display
![]() : Zoom in the screen
: Zoom in the screen
![]() : Zoom out the screen
: Zoom out the screen
![]() : Turn on/off the axis.
: Turn on/off the axis.
Display Cell Numbers
Note
Fiber Cells are assigned numbers according to the following rules:
Numbering order for materials: from Concrete Cell to Steel Cell
Numbering order for directions: 1. from left to right, 2. from up to down
Note
z and y axes displayed in the Fiber Section Animation window represent the element local z and y axes, respectively (looking at the member from the I-end of the member).
![]() Fiber State
Fiber State
Specify the state of the output display for the fiber model.
Tension: Display the analysis results of the tension side.
Compression: Display the analysis results of the compression side.
Elastic, Crack, Yielding, Crushing: Select colors for each fiber state
Blending: Define the intensity of the display colors.
Time Step: Select a time history step at which analysis results will be produced.
![]() : Initialize the fiber model.
: Initialize the fiber model.
![]() : Plot the analysis results of the fiber model.
: Plot the analysis results of the fiber model.
![]() : Graphical data for analysis results can be saved in the Windows Bitmap (BMP) file format.
: Graphical data for analysis results can be saved in the Windows Bitmap (BMP) file format.
Fiber State definition is different for reinforcing steel and concrete and for each material model. Definition of Fiber State is as follows:
|
|
||||||||||||||||||||||||||||||||||||||||||||||||||||||||||||||||||
|
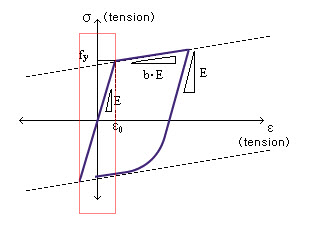
Menegotto-Pinto Model
Elastic within the rectangle zone and Yielding elsewhere
Bilinear Model
Elastic within the rectangle zone and Yielding elsewhere
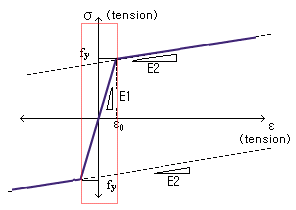
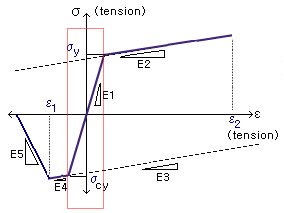
Unsymmetric Bilinear Model
Elastic within the rectangle zone and Yielding elsewhere
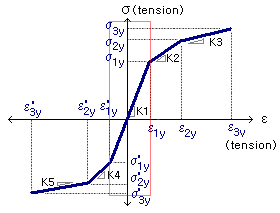
Trilinear Model
Elastic within the rectangle zone and Yielding elsewhere
|
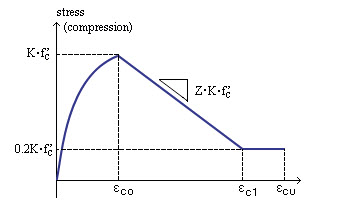
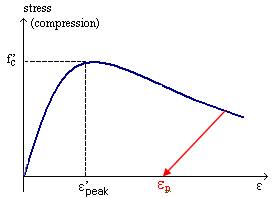
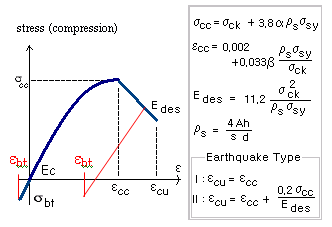
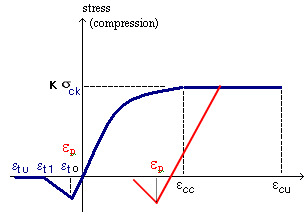
Kent & Park Model
Japan Concrete Standard Specification Model
Japan Roadway Specification Model
Japan Highway Corporation Model
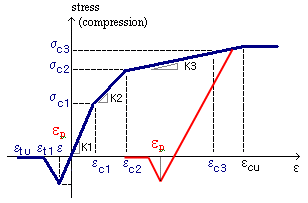
Trilinear Concrete Model
|
![]() Animation
Animation
Select the time history step at which the analysis results need to be produced.
|
Step: Specify the step at which the time history analysis results need to be displayed. If a specific step is entered, it moves to the step directly. Increment: Graphic output is produced and recorded at the specified increment. Time: The actual time of the loading corresponding to the current step is produced.
|