FCM Camber Graph View
Camber Control Graph of a bridge analyzed for construction stages by FCM is produced.
From the Main Menu select Results > Bridge > Camber/Reaction > FCM Camber > FCM Camber Graph View.
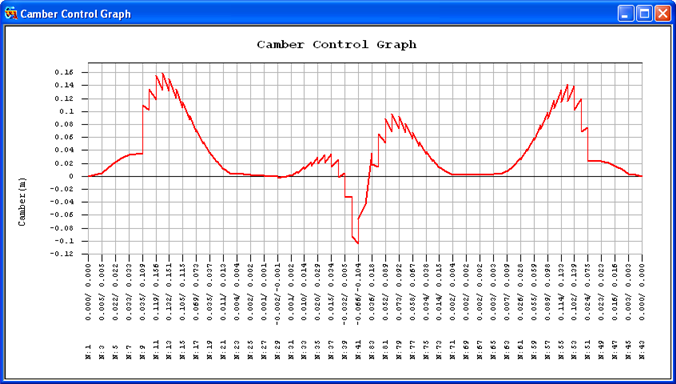
The X-axis of the graph represents the length (or nodes) of the bridge and the Y-axis represents the corresponding cambers. Two values are produced for each node. The upper values signify the cambers to be considered at the time of installing the formwork whereas the lower values signify the displacements that would occur upon removal of the formwork after casting the concrete at the corresponding nodes.
If the above conditions are satisfied, the deflections of the main girders will be '0' and remain horizontal upon completion of construction.
|
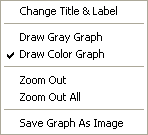
Right-click on the FCM Camber Graph displayed on the screen to prompt the following Context Menu. |
|
|
|
Change Title & Label Draw Color Graph Draw Grey Graph Zoom Out Zoom Out All Save Graph As Image Save Graph As Text |