Tendon Arrangement (Tendon Group)
Check the effective stresses, effective prestress forces of tendons for each Tendon Group or Construction Stage in a table. The table also produces the distance from the Tendon Group center to the section's neutral axis and directional cosine to place tendons, with which vertical and horizontal components of tendons can be computed easily.
From the Main Menu select Results > Result Tables > Tendon > Tendon Arrangement
Tendon Group: Select a Tendon Group for which the results will be produced. Tendon Group should be predefined prior to the analysis since the results are produced by Tendon Groups.
Stage: Select a construction stage for which the results will be produced.
Apply: Click the button to produce the tendon results for the corresponding Tendon Group and Construction Stage.
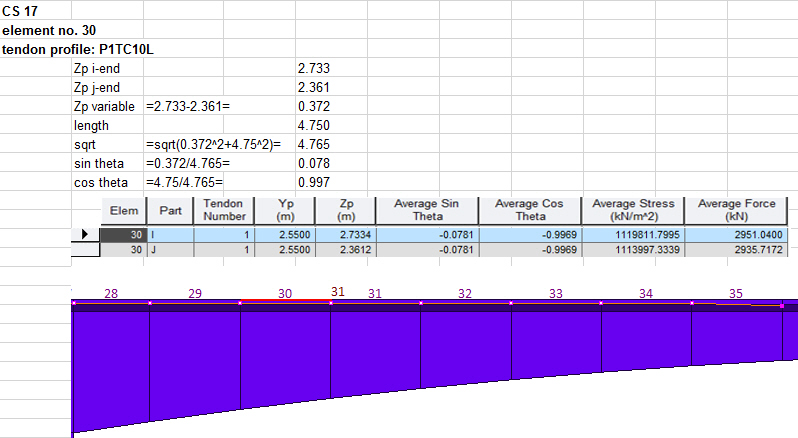
Elem: Element number
Part: Locations at which the tendon results are produced
Tendon Number: Number of tendons of the selected Tendon Group
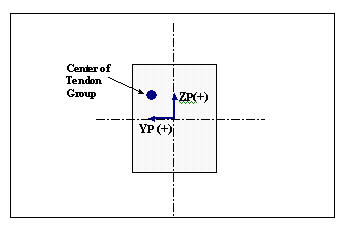
Yp: Distance from the section's neutral axis to the Tendon Group center in the ECS y-direction
Zp: Distance from the section's neutral axis to the Tendon Group center in the ECS z-direction
Average Sin θ: Sine of an inclination angle of tendon
Average Cos θ: Cosine of an inclination angle of tendon
Average Stress: Effective stresses of a Tendon Group (Effective stresses are computed by dividing effective prestressing force considering tendon loss by tendon area at the Last Step of each stage)
Average Force: Effective prestressing force of a Tendon Group (Effective prestressing force considering tendon loss is computed at the Last Step of each stage)
Check the instantaneous tendon loss graph
Effective prestressing forces of tendons produced in a table represent instantaneous losses (friction loss, anchorage slip and elastic shortening) and long-term losses (relaxation of tendon, creep and shrinkage). Right click on the table and select Tendon Immediate Loss Graph to check the effective prestressing forces due to the instantaneous losses in a graph.
TFL: Effective prestressing forces of tendons due to friction losses only
TSL: Effective prestressing forces of tendons due to friction losses and anchorage slip
![]() Revision of Civil 2015 (v1.1)
Revision of Civil 2015 (v1.1)