Beam Detail Analysis
Produce a detail deformed shape, SFD/BMD, maximum stress distribution and sectional stress distribution diagrams for a particular section. Transformed section for tendons is not considered in Beam Detail Analysis. If a load combination, which contains moving loads, Beam Detail Analysis cannot be checked.
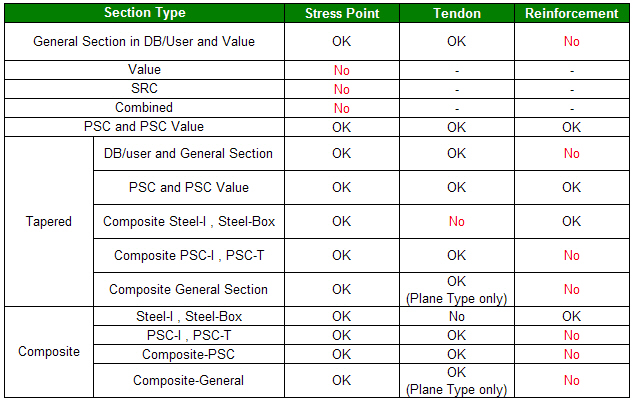
Stresses can be calculated at any points of the section for the various section types (DB, PSC, Tapered Section, Composite Section, General and Composite General Section).
From the Main Menu select Results > Detail > Beam/Element > Beam Detail Analysis.
|
When the element is assigned, the following results window is displayed.
 DISP/SFD/BMD z-dir. Results Window
Produce deformed shape, SFD and BMD for the beam element's strong axis
Displacement: Dz
Deflected shape in the element's local z-direction and the corresponding numerical values
Di (abs) : Absolute displacement at node i (N1)
Dj (abs) : Absolute displacement at node j (N2)
Di (rel) : Relative displacement at node i (N1)
Dj (rel) : Relative displacement at node j (N2)
Note
The relative displacement is obtained by setting the smaller displacement of nodes i or j to 0 (zero) and calculating the relative displacement of the other node.
Dmax (abs) : Maximum absolute displacement and the position
Dmax (rel) : Maximum relative displacement
Dmin (abs) : Minimum absolute displacement and the position
Dmin (rel) : Minimum relative displacement
Duser (abs) : Absolute displacement and the position at the location assigned by the user
Duser (rel) : Relative displacement and the position at the location assigned by the user
Note
Move the mouse cursor to the left or right in the displacement graph or use the slide button at the bottom of the results window to assign the position of interest.
Shear Force Diagram: Fz
Shear force in the element's local z-direction and the corresponding numerical values
Fi: Shear force at node i
Fj: Shear force at node j
Fmax: Maximum shear force and the position
Fmin: Minimum shear force and the position
Fuser: Shear force and the position at the location assigned by the user
Bending Moment Diagram: My
Bending moment about the element's local y-axis and the corresponding values
Mi: Bending moment at node i
Mj: Bending moment at node j
Mmax: Maximum bending moment and the position
Mmin: Minimum bending moment and the position
Muser: Bending moment and the position at the location assigned by the user
DISP/SFD/BMD y-dir. Results Window (Refer to DISP/SFD/BMD z-dir. Results Window)
Produce the deformed shape, SFD and BMD for the beam element's weak axis
Displacement: Dy
Deflected shape in the element's local y-direction and the corresponding numerical values
Shear Force Diagram: Fy
Shear force in the element's local y-direction and the corresponding numerical values
Bending Moment Diagram: Mz
Bending moment about the element's local z-axis and the corresponding numerical values
Section Results Window
Entry
Section Stress
Select a stress component and the corr![]() esponding member force components in the dialog bar of Beam Detail Analysis and click .
esponding member force components in the dialog bar of Beam Detail Analysis and click .
Stress components
Normal
Stress in the element's local x-direction (![]() )
)
Axial stress + Bending stresses due to My and Mz
Tau-xy: Shear stress in the element's local y-direction ( ![]() )
)
Tau-xz: Shear stress in the element's local z-direction ( ![]() )
)
von-Mises
von-Mises Stress = ![]()
where,
![]() : Maximum principal stress
: Maximum principal stress
![]() : Minimum principal stress
: Minimum principal stress
Tresca
Tresca Stress = ![]()
Princ.(max): Maximum principal stress
Princ.(min): Minimum principal stress
Member Force Components
Fx: Axial force in the element's x-direction
Fy: Shear force in the element's y-direction
Fz: Shear force in the element's z-direction
Mx: Torsional moment about the element's x-axis
My: Bending moment about the element's y-axis
Mz: Bending moment about the element's z-axis
Output
Longitudinal Maximum Stress
Provide the maximum and minimum distribution diagram and the corresponding numerical values for the assigned stress component along the length of a beam.
Sig-i: Maximum section stress at node i (N1) (![]() )
)
Sig-j: Maximum section stress at node j (N2) (![]() )
)
Sig-max: Maximum stress and the position (![]() )
)
Sig-min: Minimum stress and the position (![]() )
)
Sig-user: Sig-user: Maximum stress at the user-defined position / users can define the position within the x coordi.(![]() )
)
Note
Move the mouse cursor to the left or right in the maximum stress graph to assign the position of the stress to be checked.
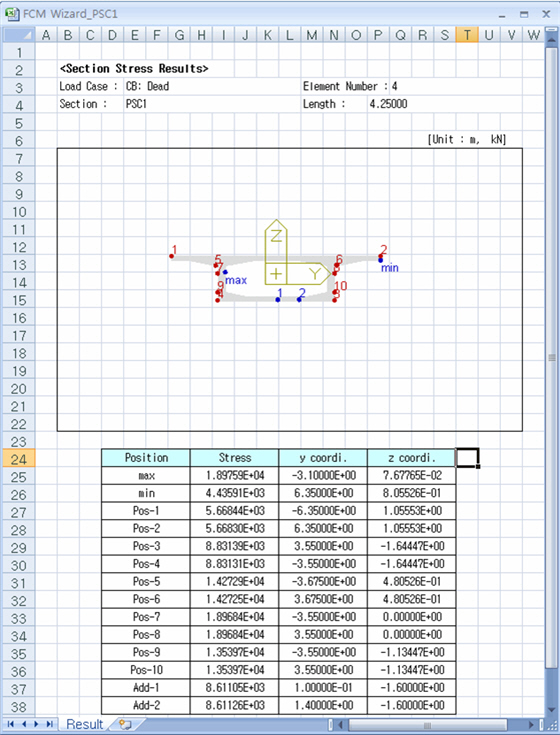
Cross Section Stress
Display the stress distribution and the corresponding values for a particular section of the beam element.
Sig-max: Maximum stress and the position in the section (![]() )
)
Sig-min: Minimum stress and the position in the section (![]() )
)
Pos-1~Pos10 : Stresses at the Base Points
Add-1~ : Stresses at the Additional Stress Points added from the Section Manager
Assign the desired position (on the element's local y-z plane) in the section stress distribution diagram by moving the mouse cursor to the left or right and up or down. In addition, assign the desired position along the length (in the element's local x-axis) by moving the mouse cursor to the left or right in the maximum stress graph.
![]() :Click the Section Manager button to add Additional Stress Points.
:Click the Section Manager button to add Additional Stress Points.
The added Stress Points will be immediately reflected in the ’r;Cross Section Stress’ of the ’r;Beam Detail Analysis’
![]() :Produce an Excel Report.
:Produce an Excel Report.
Location
abs: Distance from the i node to the position assigned by the user
rel (X/L): Distance ratio relative to the total length for the position assigned by the user
Applied Forces/Moments [Fx, Fy, Fz, Mx, My, Mz]: Member forces at the position along the length assigned by the user
Note
The results produced in the Diagram and the Table can be different from those of Beam Detail Analysis since the moment of inertia can be different depending on the way of applying the axis (local direction). (Refer to Note 1. In Beam Detail Analysis, the section properties at the positions (1/4, 1/2 & 3/4) are re-calculated using the section shape information at the corresponding positions whereas in diagrams and tables, section properties at the positions (1/4, 1/2 & 3/4) are obtained by interpolation between i-end and j-end.)