Stage/Step History Graph
Plot history graphs by steps and stages or load cases/combinations using the analysis results of a structural model, which is analyzed for construction stages and steps that typically form the basis for a geometric nonlinear analysis or construction stage analysis.
From the Main Menu select Results > Time History > Stage/Step History Graph.
|
![]() Load Cases/Combinations
Load Cases/Combinations
Select a load case/combination or construction stage load case for which the history graph is to be plotted.
Note
Refer to Combinations for construction stage load cases provided in the post-processing mode of a construction stage analysis.
![]() When Multi LCase Mode is selected
When Multi LCase Mode is selected
![]() Check Load Cases to Plot
Check Load Cases to Plot
Check on the load cases/combinations or construction stage load cases for which history graphs are plotted.
Note
Refer to Combinations for construction stage load cases provided in the post-processing mode of a construction stage analysis.
![]() Define function
Define function
From the list of the defined output functions, select an output function.
![]() Graph Title
Graph Title
Enter the title for the graph.
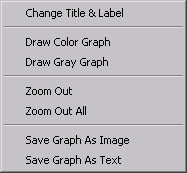
![]() : Generate the graph corresponding to the defined output functions and loading conditions.
: Generate the graph corresponding to the defined output functions and loading conditions.
![]() : Close the dialog box.
: Close the dialog box.
Note Method of defining graphic output functions
![]() When Displacement is selected in Define Function
When Displacement is selected in Define Function
.jpg)