Define Diagram
Define the items required to generate a User Defined Diagram.
Using the User Defined Diagram, member forces and stresses of the beam elements as well as displacements, truss member forces and stresses, can be drawn in a diagram. In addition, various results by element types (or element groups) can be drawn in the same diagram simultaneously.
As shown in the example below of a 3 span continuous bridge, shear forces are drawn in the 1st span, bending moments in the 2nd span and stresses in the 3rd span simultaneously.
To plot a User Defined Diagram, first define Types of Results for desired element Groups in "User Defined Diagram > Define Diagram" and then plot the diagram from "User Defined Diagram > Plot Diagram"
Different types of results can be combined in the same construction stage for plotting, but the results from different construction stages cannot be combined.
From the Main Menu select Results > Results > Diagram >Define Diagram.
![]() Element
Element
Enter element numbers for which display types are to be specified. Click [...] on the right to invoke the Structure Group dialog box in which the currently defined Structure Groups are listed. Select a Group, and then the element numbers which are contained in the Group are automatically selected.
![]() Type of Result
Type of Result
Select a Type of Result to be generated. The following Types of Result can be generated in User Defined Diagram:
Displacement
Truss Force
Truss Stress
Beam Force
Beam Stress
PSC Beam Stress
![]() Component
Component
Select a component desired for generating results. Depending on the Type of Result selected, components are automatically altered.
![]() Group Name
Group Name
Enter a Group Name of the Elements for generating the Diagram.
Select a Group from the Group Name list and click ![]() to control the display settings of the result views for the corresponding Group.
to control the display settings of the result views for the corresponding Group.
![]() Diagram Options
Diagram Options
Color: Assign the color of the Diagram.
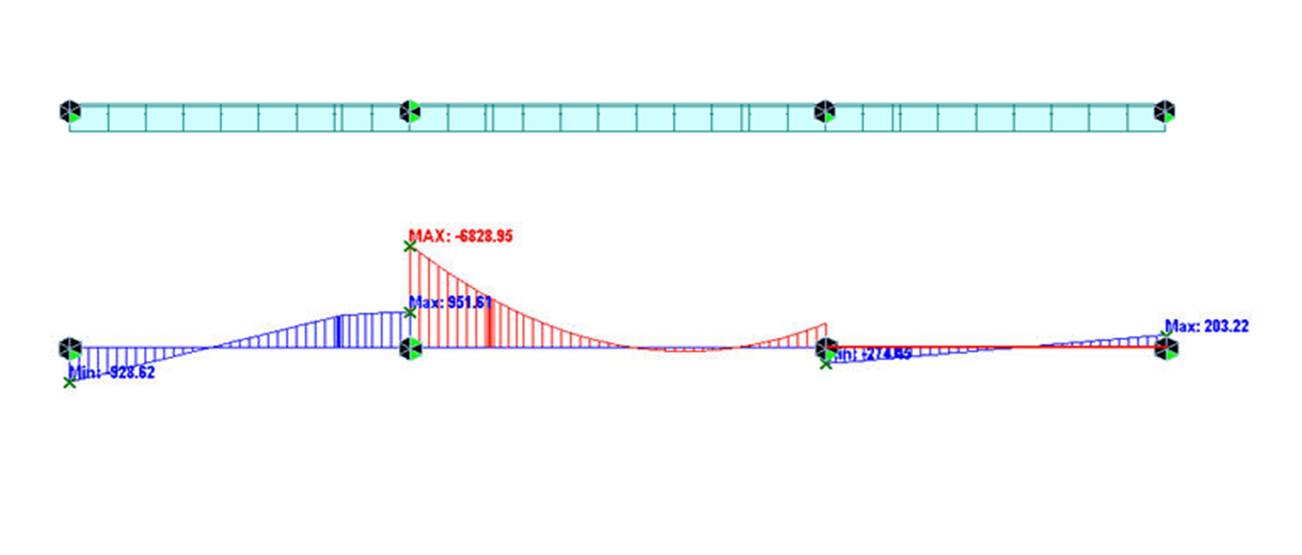
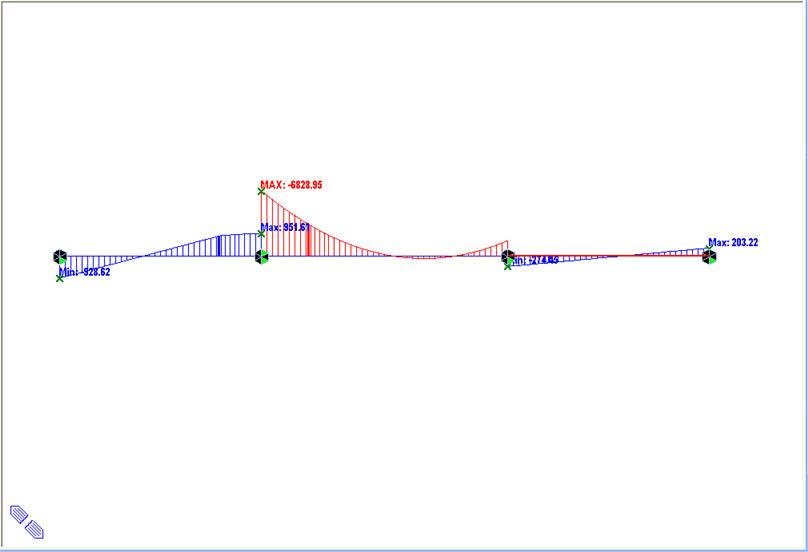
Scale: Specify a Scale Factor for the Diagram. Since the various types of results are displayed simultaneously, the defaulted Scale Factor may sometimes be inappropriate. In such cases, the user should enter the appropriate Scale Factors for each Diagram Group.
The following figure shows an example of inappropriate Scale Factors. The next figure shows an example where appropriate Scale Factors are used.
![]() Display Values
Display Values
Check the options for displaying the values on the screen.
Decimal Points: Assign decimal points for the displayed numbers.
Exp.: Express as exponential
Set Orientation: Display orientation of numerical values.
Note
The default Decimal Points can be controlled in "Preferences".
Set Orientation = 0 horizontally displays the numerical values to the right of nodes or elements.
The orientation angle represents the counter-clockwise direction, which may be used to enhance the readability of the numbers.
Output Section Location: Assign the section locations at which bending moments of the beam elements are produced in numerical values.
I: Display the bending moment at the start node (N1) of a beam element.
Center: Display the bending moment at the center of a beam element.
J: Display the bending moment at the end node (N2) of a beam element.
Abs Max: Maximum absolute values of bending moments among the 5 points of (4-sectioned) beam elements are displayed at the centers of the beam elements.
Min/Max: Minimum and maximum bending moments are numerically displayed at the corresponding locations among the 5 points of (4-sectioned) beam elements.
All: The bending moments at the i-end, center and j-end are numerically displayed.
Min/Max Only in Group: Display only the maximum/minimum value in each Group.
Min & Max: Display the maximum and minimum values.
Abs Max: Display the absolute maximum value.
Max: Display only the maximum value.
Min: Display only the minimum value.
Limit Scale(%): Display all the bending moments of the beam elements, which are in the range of (Max-Min)*Limit Scale relative to the selected maximum or minimum value.