Type of Display
Controls the type of display and allows duplicate applications. This function is performed after the results are generated. The user can select any display type for the results.
1. Contour: Displays the results of analysis in contour.
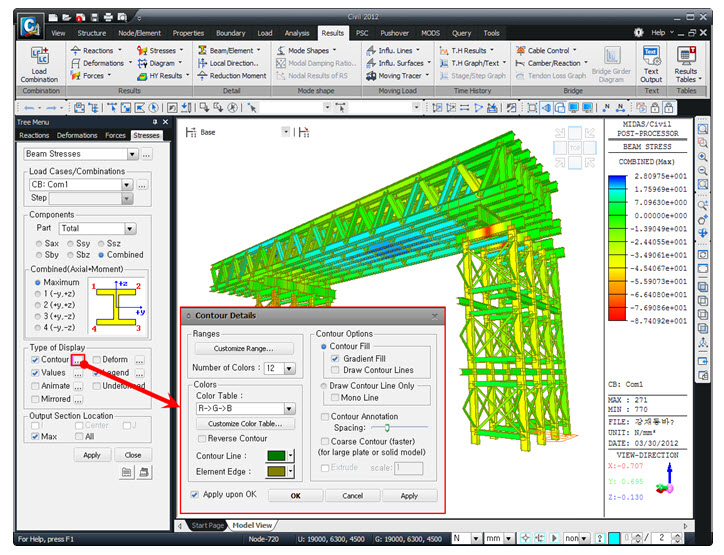
Contour Details
![]() Ranges
Ranges
Define the contour ranges.
Customize Range: Assign the color distribution range of contour. Using the function, specific colors for specific ranges can be assigned.
Customize Value: The user can assign a value that isn't in the min (Rank 0) and max (Rank 11) range. If you check on Customize Value after selecting the Rank to be modified, then you can assign the contour value.
Contour Min/Max Value Range: The user can define the Min and Max range to display. The Rank in the range will be distributed equally.
Drawing Mode: Assigns the display method when the user reduces the min/max display range.
Transparency: Displays transparent
Same Color: Displays the same color before modified.
Number of Colors: Selects the number of color to draw the contour. (select from 6, 12, 18, 24 colors)
![]() Colors
Colors
Assign or control the colors of the displacement contour.
Color Tables: Assign the type of Colors.
![]() : Control the colors by zones in the contour.
: Control the colors by zones in the contour.
|
Reverse Contour |
: |
Check on to reverse the sequence of color variation in the contour. |
|
Contour Line |
: |
Assign the boundary line color of the contour |
|
Element Edge |
: |
Assign the color of element edges while displaying the contour |
![]() Contour Options
Contour Options
Specify options for contour representation
Contour Fill
Gradient Fill: Displays color gradient (shading) in the contour.
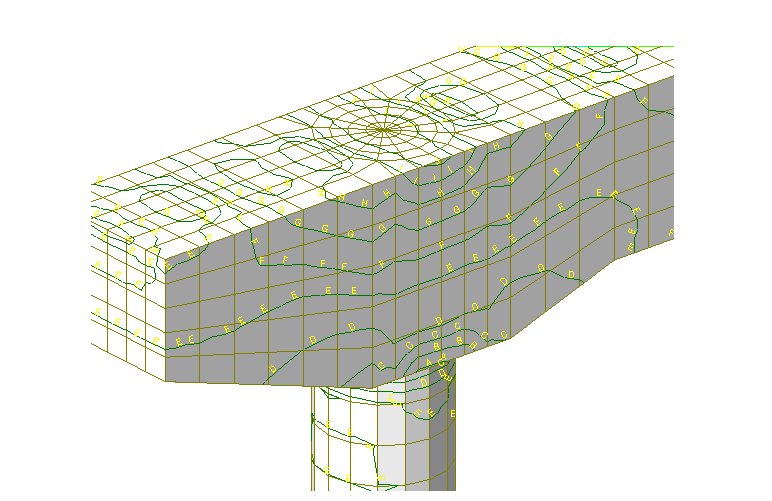
Draw Contour Lines: Displays color boundaries in the contour.
Draw Contour Line Only: Displays only the colored boundaries of the contour.
Mono line: Displays the boundaries of the contour in a mono color.
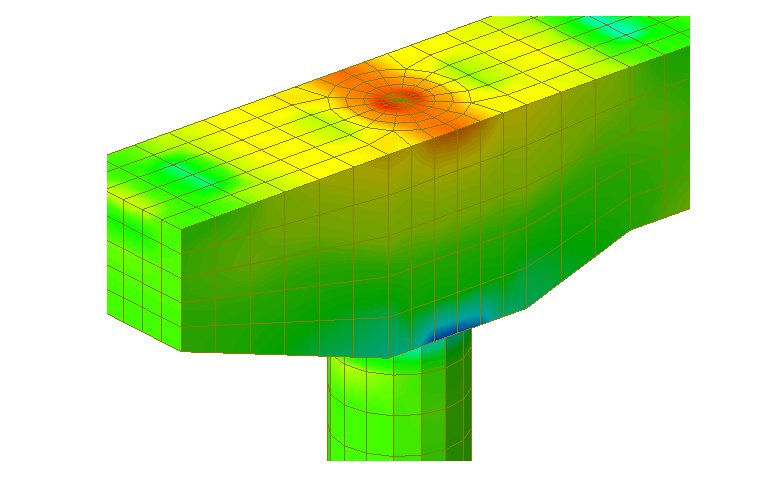
Contour Fill (Gradient Fill)

Contour Fill (Draw Contour Lines)
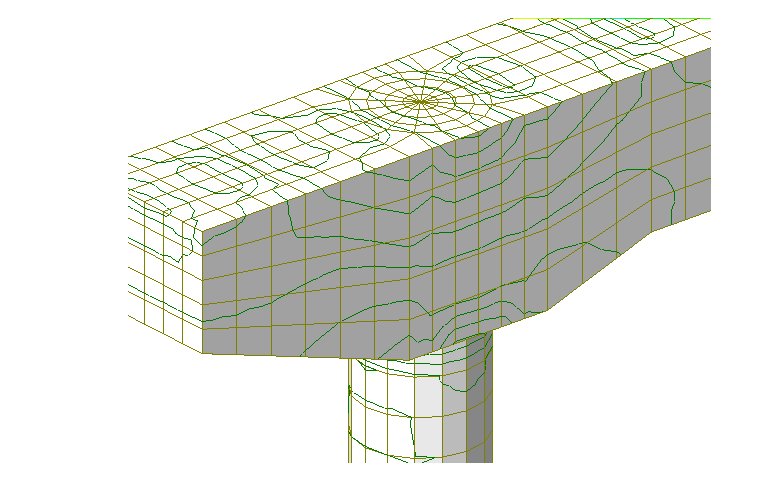
Draw Contour Line Only
Contour Annotation: Displays the legend or annotation signifying the ranges of the contour.
Spacing: Displays the spacing for the legend or annotation.
Contour Annotation
Contour Annotation Spacing
Coarse Contour(faster) (for large plate or solid Model) : Generates a simplified contour for a large model using plate or solid elements in order to reduce the time required to generate a complete contour.
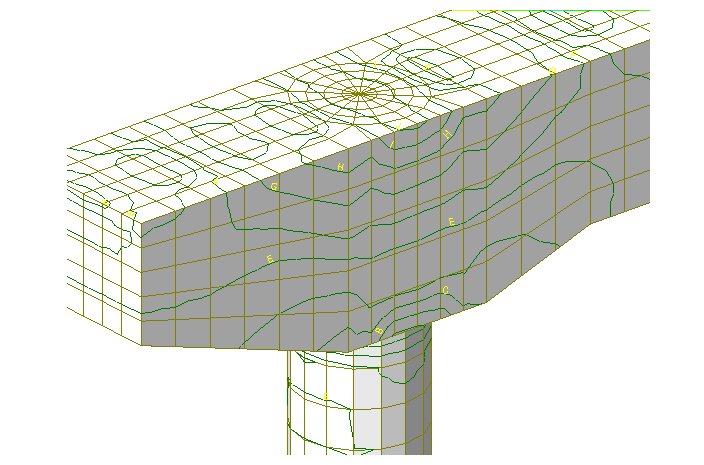
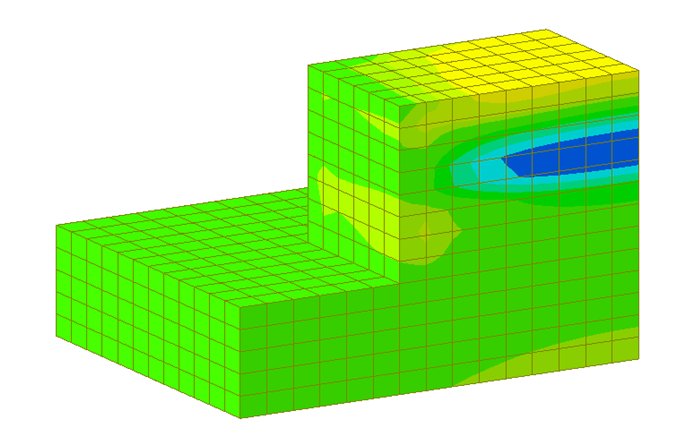
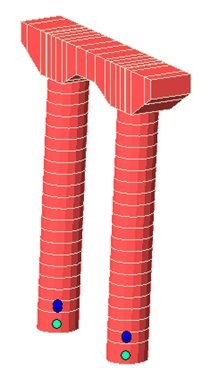
Extrude: Where plate elements or solid elements along a cutting plane are represented in contour form, a three dimensional contour is created. The positive direction of the analysis results is oriented in the z-axis direction of the local element coordinate system.
The option is not concurrently applicable with the "Deformed Shape" option. Similarly, the option cannot be concurrently applied to the cases where the "Hidden" option is used to display plate element thicknesses or the "Both" option is used to represent top and bottom member forces
Extrude
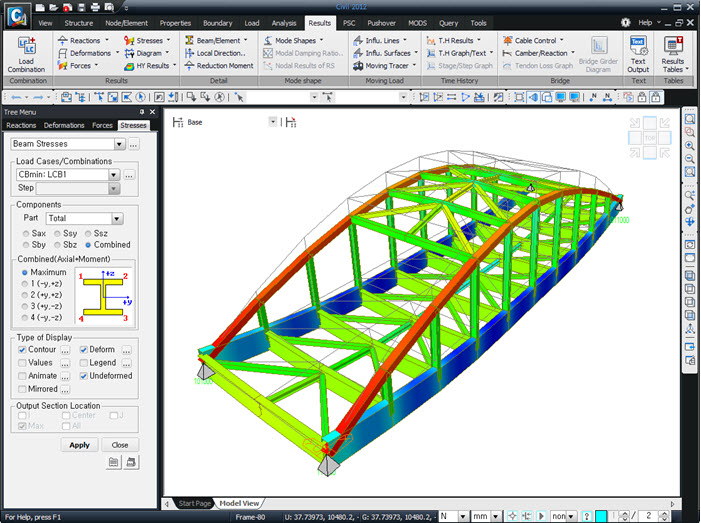
2. Deform: Displays the deformed shape of the model.
Deformation Scale Factor: Magnifies or reduces the size of the displacement that is graphically displayed in the model window.
Deformation Type: Selects the type of display for displacement.
Nodal Deform : Displays the deformed shape reflecting only the nodal displacements.
Real Deform: Displays the detailed deformed shape calculated along the sections between both ends of beam elements together with the nodal displacements.
Real Displacement(Auto-Scale off): The true deformation of the structure is graphically represented without any magnification or reduction. This option is typically used for geometric nonlinear analysis reflecting large displacements.
Relative Displacement: The deformation of the structure is graphically represented relative to the minimum nodal displacement, which is set to 0.
3. Values: Displays the nodal displacements in numerical values.
The font and color of the numbers can be controlled in Display Option
Decimal Points:Selects the number of decimal point to display. Decimal Points can be initially settled at Preference.
Exp.: Displays exponential value.
MinMax Only: Displays Min. and Max. value.
Min & Max: Displays Min. and Max. value
Abs Max: Displays the absolute Maximum value.
Max: Displays Maximum value
Min: Displays Minimum value
Limite Scale(%): By selected Minimum and Maximum value this displays every value in (Max-Min)*Limit Scale limit.
Set Orientation : Sets the orientation of the value.
4. Legend: Displays and reorganizes the results from analysis.
Location of the legend can be on either side of the Model View window. Also displays the element number that contains the Max/Min value is.
Legend
Legend Position: Position of the legend in the display window
Rank Value Type: Specify a type of values in the Legend and the number of decimal points.
Note
If you click on Legend on model view the user can modify Maximum and Minimum Value. If the user changes the value then each range will automatically recalculate and modify.
5. Animate: Dynamically simulates the transition process.
Click ![]() then click
then click ![]() Record to the right of the Animation control board at the bottom of the working window
Record to the right of the Animation control board at the bottom of the working window
![]() Animate Mode
Animate Mode
Option for dynamic display of results.
Animate Contour: Option to change the color of the contour representing the transition according to the magnitudes of variation
Repeat Half/Full Cycle : Select the repetition cycle for the dynamic representation of the transition
Note
Select 'Half Cycle' for the transient shapes of a structure and 'Full Cycle' for dynamically simulating vibration modes or buckling modes
![]() AVI Options
AVI Options
Enter the options required to produce the animation window.
Bits per Pixel: Number of bits per pixel to create the default window for animation
![]() : Assign the method of compressing image data
: Assign the method of compressing image data
Frames per Half Cycle : Number of frames to simulate a 'Half Cycle'
Frames per Second : Number of frames per second to present dynamic simulation
![]() Construction Stage Option
Construction Stage Option
Select the animation options when the construction stage analysis is performed.
Stage Animation : Animations by construction stages
Current Stage-Step : Animations by Steps in the current construction stage
From ~ To : Starting and ending construction stages or steps for animations
Only Model Animation: Animates only the model not including any analysis for each construction stage.
![]() Icons to Control Dynamic Display
Icons to Control Dynamic Display

6. Undeformed : Overlap the un-deformed and deformed shapes of the model.
Undeformed function
7. Mirror: "Mirrored" allows the user to expand the analysis results obtained from a half or quarter model into the results for the full model by reflecting planes
Half Model Mirroring:Allows the user to expand the analysis results obtained from a half model to the results for the full model, by reflecting the planes of symmetry.
Quarter Model Mirroring:Allows the user to expand the analysis results obtained from a quarter model to the results for the full model, by reflecting the planes of symmetry.
Mirror by : Specify the mirror plane (s) by designating a plane and a coordinate in the direction perpendicular to the plane in GCS.
Before applying Mirror function
After applying Mirror function
8. Quick View : The user can check the Shear Force Diagram and the Bending Moment Diagram by the process of detailed beam element analysis. By using P-Delta analysis, the internal displacement for determining the accurate moment is calculated. Note that this only applies to simple beams.
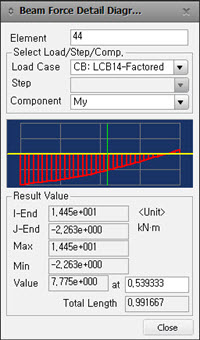
Quick View
![]() Element
Element
The user can input the element number. The user can also click on the element box then select each element individually by clicking the element in Model View.
![]() Select Load/Step/Comp.
Select Load/Step/Comp.
Load Case: Select Load Conditions or Load Combinations for analysis.
Step: Select the step to display the analysis results. The user can define Additional Step in nonlinear geometry analysis or construction stage analysis of high-rise buildings or heat of hydration analysis
Note
To select the construction stage to display, the user can specify the construction stage at Select Construction Stage for Display or on the Stage Toolbar.
Component : Select the force components of the element from the followings:
Fx: Force component in local coordinate system x-direction.
Fy: Shear component in local coordinate system y-direction.
Fz : Shear component in local coordinate system z-direction.
Mx: x-axis torsional moment in local coordinate system.
My: y-axis torsional moment in local coordinate system.
Mz : z-axis torsional moment in local coordinate system.
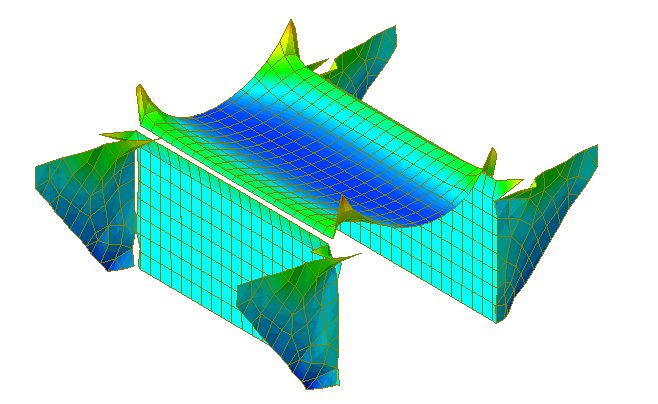
9. Plate Cutting Diagram : Displacement of plate elements is generated as a graph along a specific line or plane cut through the elements. The following dialog box is used to specify the conditions required to generate the displacement diagram along the cutting line/plane.
![]() Plate Cutting Diagram Mode
Plate Cutting Diagram Mode
Cutting Line: Produce a graph along a cutting line
Cutting Plane: Produce a graph along the line of intersection of the cutting plane and plate elements
When Cutting Line is selected
Defined Cutting Lines: List of defined Cutting Lines
Add: Add the information contained in the Cutting Line Detail to the list of Defined Cutting Lines
Del: Delete a defined cutting line
Modify: Modify a defined cutting line
Cutting Line Detail: Defines the cutting line to register.
Name: The name of the cutting line to register
Pnt1: Point where the cutting line starts
Pnt2: Point where the cutting line ends
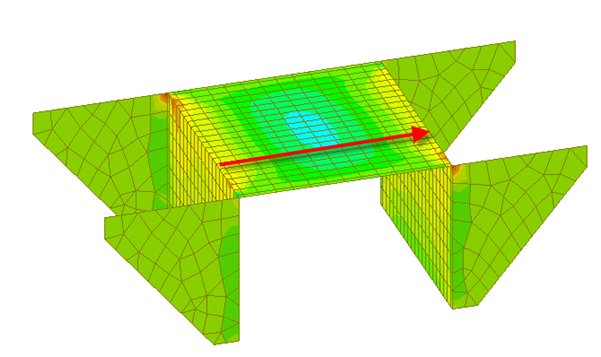
Create a Cutting Line
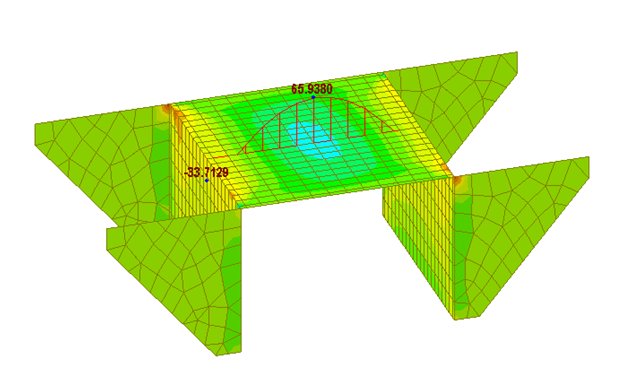
Plate Cutting Diagram (Cutting Line)
Options: Specify the display color and the plane on which the graph is produced
Normal: Display the graph in the Normal direction of plate elements
In Plane: Display the graph in the In-Plane direction of plate elements
Scale factor: Scale factor for diagram output ratio
Reverse: Express the Diagram in the reverse direction.
Graph: Produce the output in a Graph Window (valid only if 'Cutting lines' is selected).
Draw graphs on separate panes: Graphs pertaining to different Cutting Lines/Planes produced separately
Draw graphs on all in one pane: All the graphs pertaining to different Cutting Lines/Planes simultaneously produced in one graph
X-Axis: Define the X-axis of the graph
Distance From Pnt1: Distance from the first point
Global X Coord.
Global Y Coord.
Global Z Coord.
Value Output: Produce the output in values.
MinMax Only: Show only the maximum and minimum values when Value Output is selected.
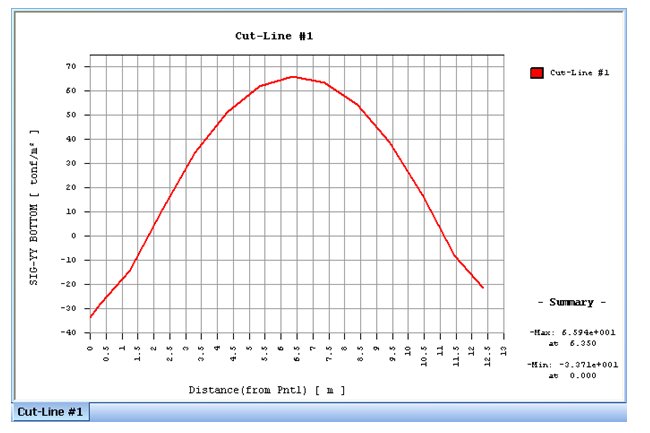
Graph function of Plate Cutting Diagram
When Cutting Plane is selected
Named Planes for Cutting
Select a plane from the defined planes and UCS x-y, x-z & y-z planes
Plate Cutting Plane Detail
Normal to plate: Consider a Cutting Plane parrallel to the Local Element Coordinate System z-axis of the plate elements
On cutting plane surface: Consider a Cutting Plane as per a defined plane
Draw continuous lines: Display the graphs for plate elements placed on different planes in a continuous line.
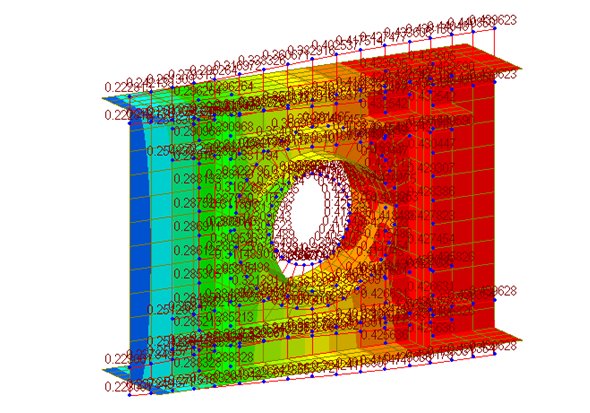
Plate Cutting Diagram (Cutting Plane)
Draw continuous lines applied
Draw continuous lines not applied
Scale Factor: Scale factor for diagram output ratio
Reverse: Express the Diagram in the reverse direction.
Value Output: Produce Output in numerical values
Min/Max Only: Upon selecting Value Output, display only the Maximum and Minimum values.
10. Hinge Status: When the pushover analysis is performed this displays a label if plastic hinge occurs.
11. Current Step Disp.
Produce the displacements pertaining to the selected step of the construction stage if a construction stage analysis has been performed.
12. Yield Point
This displays when the results appear to be larger than the Initial Uniaxial Yield Stress of a Plastic Material.
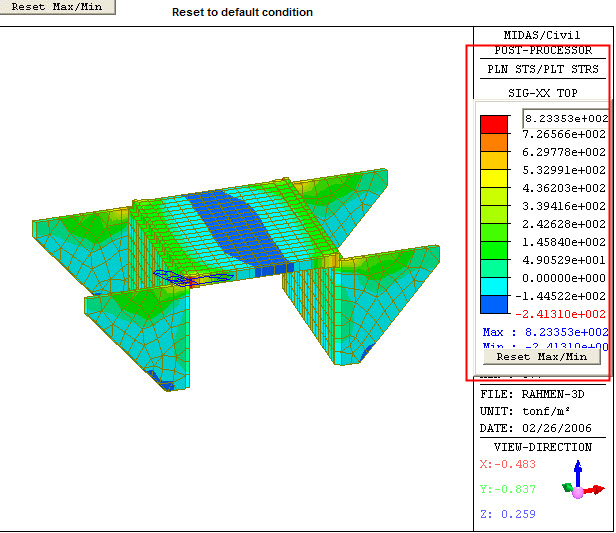
13. Cutting Plane
Graphically displays the stress of an arbitrary cutting plane. The detail setting dialogue box to define the cutting plane to produce and view the solid element displacements is shown below.
![]() Named Planes for Cutting
Named Planes for Cutting
Select a plan from the planes defined and ucs x-y, x-z & y-z planes. Apply the cutting planes checked with "V".
Outline Type
Outline (highlight) the solid element model using the following options to clearly view the displacement on the cutting plane:
The Outline color is selected in the Color or Print Color tab of the Display Option by the Element Free Face/Edge.
Free Face: Draw the outline of all the faces that are not in contact with other solid elements.
Free Edge: Draw only the outline of the edges that are not in contact with other solid elements.
Ani.Option Hide: Shows the detailed options for the animation.
Animation Option: This option is used with Animate function in Type of Display. By the options below this will display the stresses of the sliced 3-D model as a Contour animation.
Global X Sweep: Moves the sliced plane along x-axis of GCS and animates the stress contour of the concurrent plane
Global Y Sweep: Moves the sliced plane along y-axis of GCS and animates the stress contour of the concurrent plane
Global Z Sweep: Moves the sliced plane along z-axis of GCS and animates the stress contour of the concurrent plane
Plane Normal Dir.: Moves the sliced plane to its normal direction and animates the stress contour of the concurrent plane.
Rotating: Rotating the sliced plane 360 degrees using the x,y,z axis of UCS coordinate and animates the stress contour of the concurrent plane.
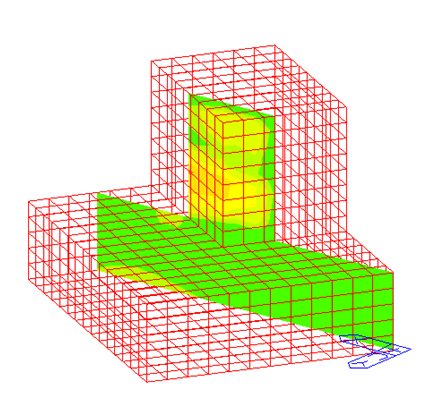
Cutting Plane (Free Face)
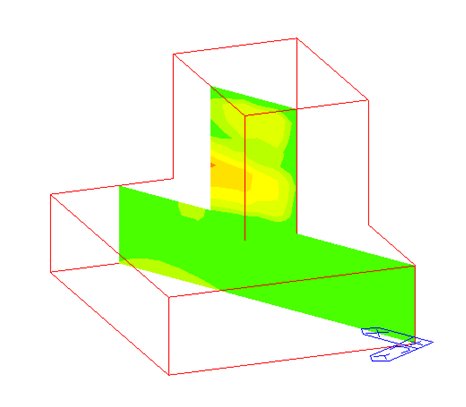
Cutting Plane (Free Edge)
14. IsoSurface: IsoSurface searches and displays the planes of equal stress resulting from analysis within the solid elements.
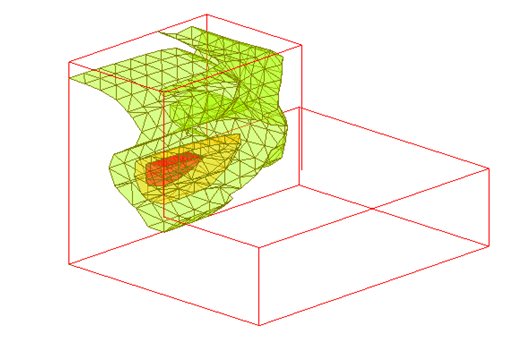
IsoSurface Display
![]() IsoValue Mode
IsoValue Mode
Select the values to be displayed for stress.
Relative(0~1): Set Max. value = 1 and Min. value = 0
Value: Actual stress value
Draw Polygon Outline: Polygonal boundaries of the planes of equal displacement s are outlined. The color of boundary lines is selected as the color of Element Edge in the Contour Details dialog box.
Transparent (Screen only): Assign a level of transparency for isosurfaces.
![]() Model Outline
Model Outline
Outline (highlight) the solid element model using the following options to clearly view the displacement of the planes of equal displacements. The color of the outline is determined from the Color of Display Option or Free Face/Edge of Element under the Print Color Tab.
Free Face: Draw the outline of all the faces that are not in contact with other solid elements.
Free Edge: Draw only the outline of the edges that are not in contact with other solid elements.
Note
IsoSurface may be used in conjunction with the Animate Option. If one IsoSurface value is entered, the planes of equal displacements are animated within the range of the displacement value and the maximum displacement value. If two or more displacement values are entered, the range of animation starts from the displacement level that is lowest of all the values to the maximum value.
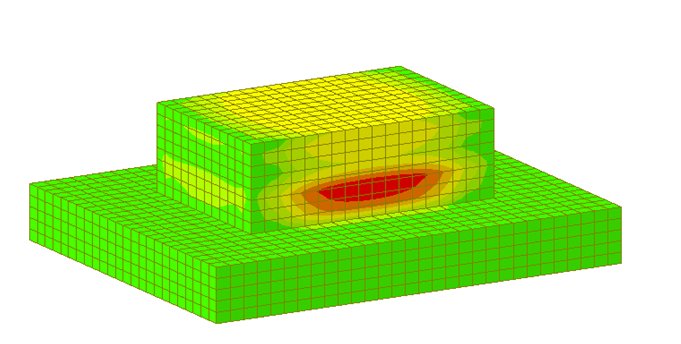
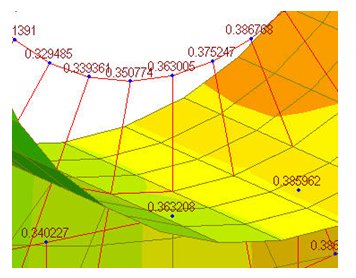
15. 3D Contour
Displays the effective stress in 3-D contour plane.
Scale Factor: Input the scale of 3-D contour plane.
Draw vertical lines: Draws vertical lines in the 3-D contour plane.
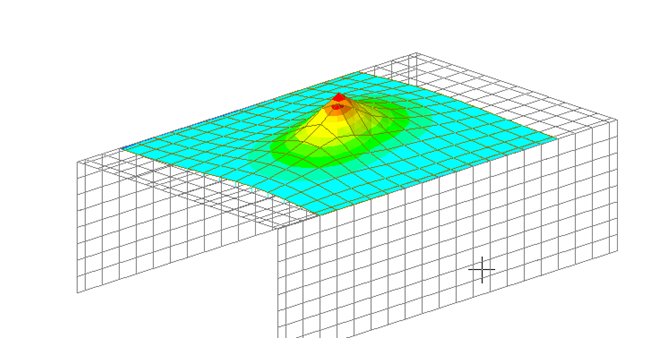
A function of 3D Contour
16. Include Impact factor
Displays Load considering impact factor. Multi-Lane Scale Factor is not included.