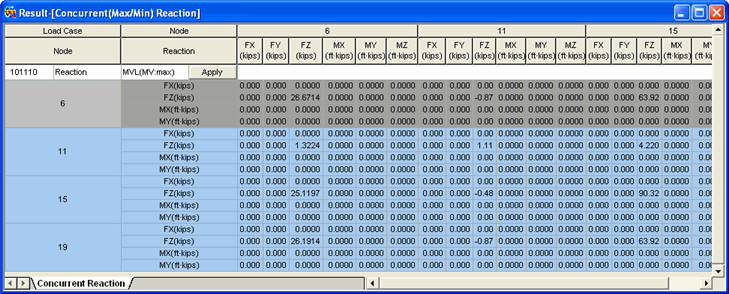
Concurrent (Max/Min) Reaction Table
The user can check the concurrent reaction data in a spreadsheet table format. Concurrent reaction can be calculated during moving load analysis or support settlement analysis.
If the user selects a group of nodal points from the Concurrent Reaction Group to calculate the concurrent reaction during moving load analysis or support settlement analysis, this table will display the concurrent reactions of nodal points that are included to the Group.
Concurrent reactions can be viewed with respect to node local axis as well as global axis.
The table tool of midas Civil is convenient to use. For more information refer to Usage of Table Tool in the online manual.
From the Main Menu select Results > Result Tables > Concurrent (Max/Min) Reaction
When the user invokes the Concurrent Reaction table, the following table will display.
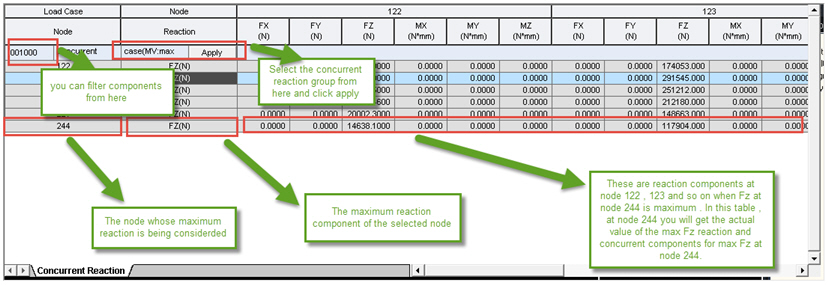
Step 1
Select the components of the reaction to be displayed. If the user clicks on the cell where 1 is located (refer to the upper picture), then the following list will appear. The user can select the component to be displayed.

Step 2
The nodal group defined from Concurrent Reaction Group will be specified.
Step 3
The user selects the loading condition.
After process
1 and 3 is completed by clicking the ![]() tab, the following table will displayed.
tab, the following table will displayed.