Interaction Curve
|
|
|
|
|
|
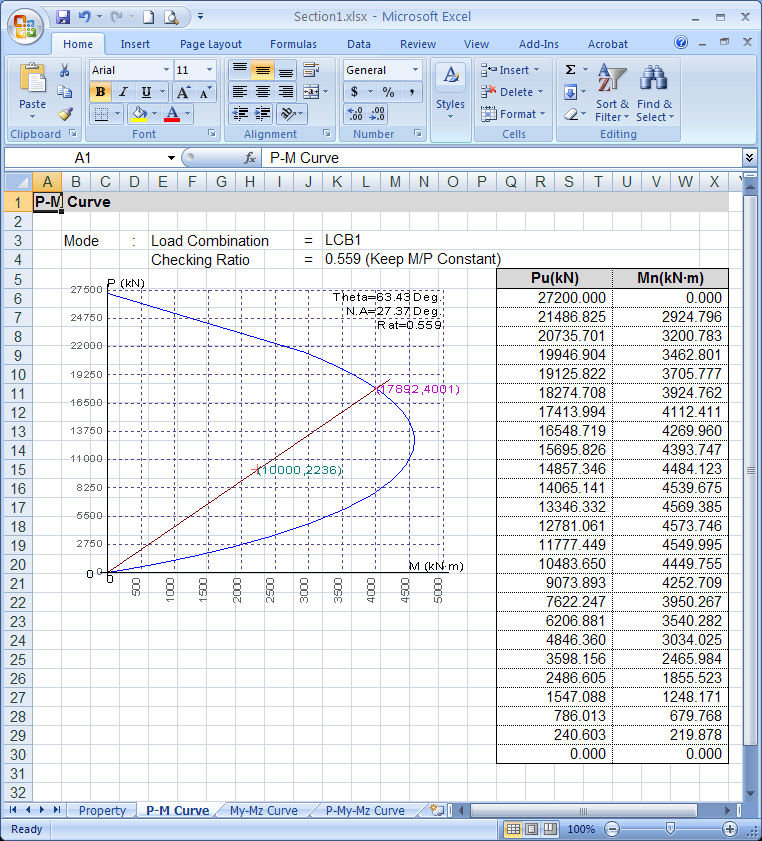
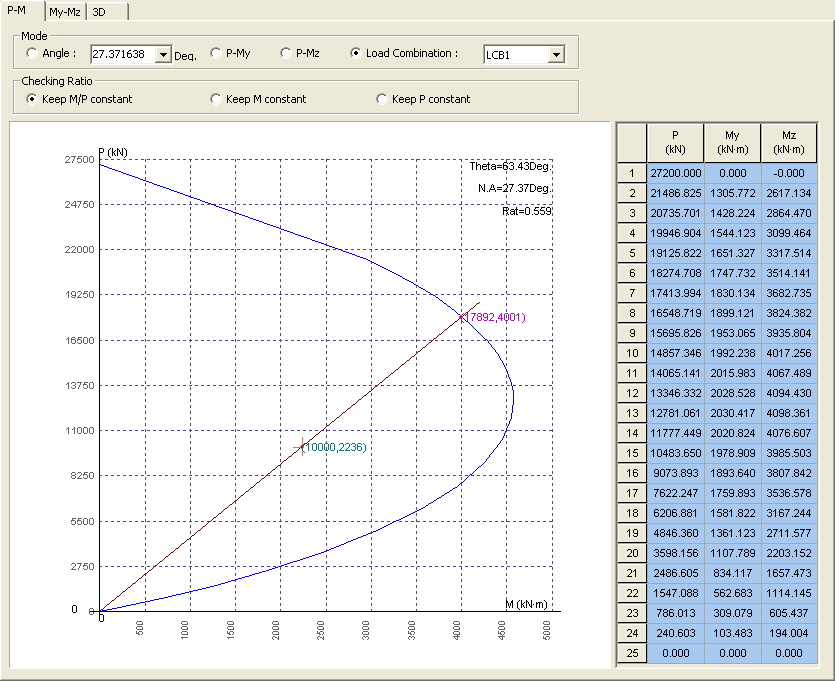
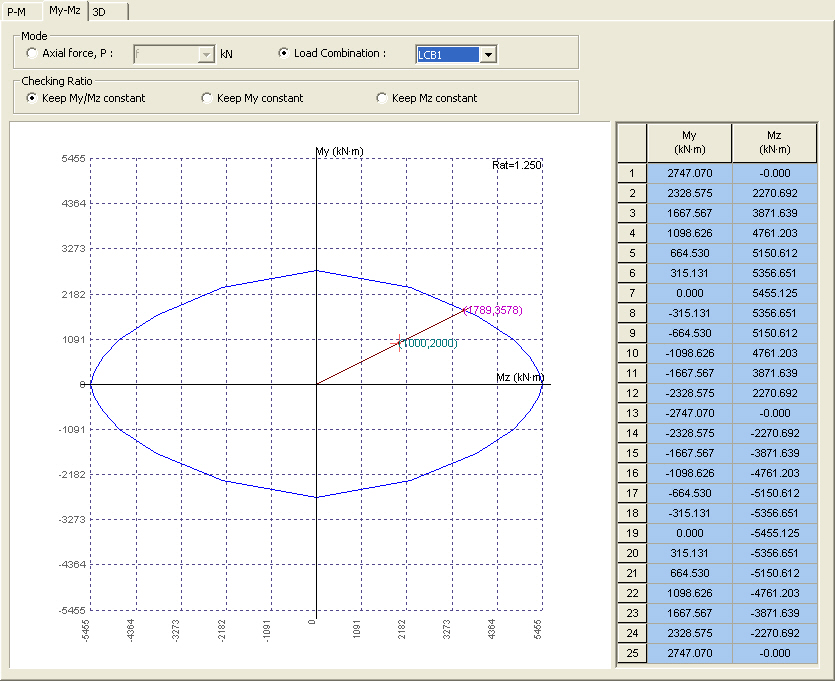
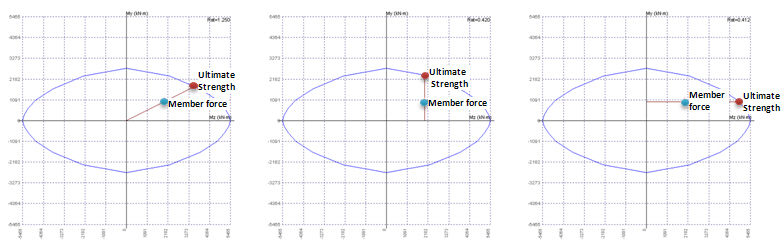
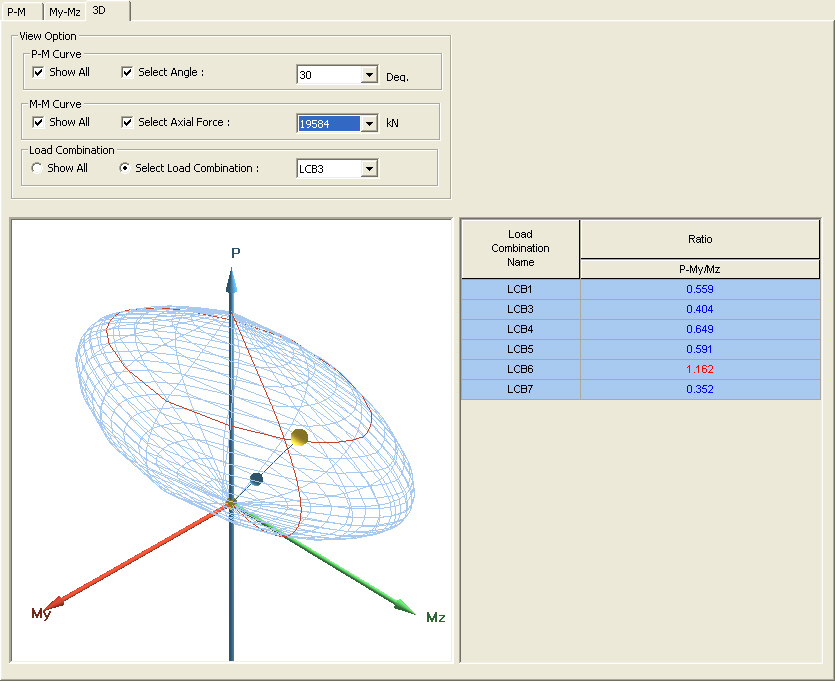
Display the P-M, My-Mz, and 3D P-M interaction curve applicable for the entered axial force and biaxial moments. |
|
|
|
|
|
|
|
From the Main Menu select Results > Interaction Curve. Click |
|
|
|
|
|
|
|
|
Interaction Curve
|
|
|
|
|
|
Display the P-M, My-Mz, and 3D P-M interaction curve applicable for the entered axial force and biaxial moments. |
|
|
|
|
|
|
|
From the Main Menu select Results > Interaction Curve. Click |
|
|
|
|
|
|
|
|
.jpg) Interaction Curve
Interaction Curve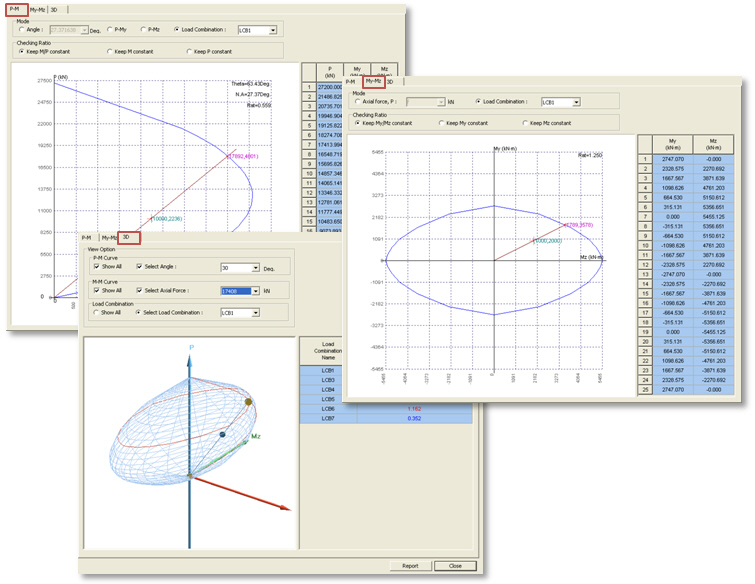
 Mode
Mode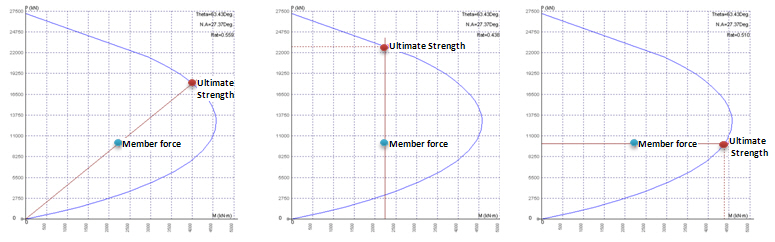
.jpg) to generate the report in Microsoft Excel format. The generated excel
file is saved in the same folder as the one that the *.mgs model file
has been saved.
to generate the report in Microsoft Excel format. The generated excel
file is saved in the same folder as the one that the *.mgs model file
has been saved.