Function
Produce graphs for column shortening of a highrise structure resulting from a construction stage analysis.
Call
From the Main Menu select Results > Column Shortening Graph for C.S..
Select Results > Column Shortening Graph for C.S. in the Menu tab of the Tree Menu.
Usage
Column Shortening Graphs
Click .jpg) to prompt the following
dialog box, and select the column location and types of graphs.
to prompt the following
dialog box, and select the column location and types of graphs.
 Name
NameEnter the name of the graph.
Coordinate Info.
Enter the location of the column in the global coordinates X & Y and allowable tolerance.
.jpg)
Select all the graphs listed below.
.jpg)
Unselect all the graphs listed below.
Note
The results produced from the graphs listed are as follows:
Elastic: Elastic shortening
Creep: Creep shortening
Shrinkage: Shrinkage shortening
Total: Sum of elastic, creep and shrinkage shortenings
Up to Casting: Column shortening immediately after casting the slab at the current story
Sub to Casting: Column shortening subsequent to casting the slab at the corresponding story
Total: Sum of column shortenings for Up to Casting and Sub to casting
Upon clicking the .jpg) button,
the graphs selected above will be listed in the dialog box.
button,
the graphs selected above will be listed in the dialog box.
Select the graphs desired to plot and
click .jpg) to plot the graphs on the model screen. Click
to plot the graphs on the model screen. Click .JPG) and
and .jpg) to change and delete the selected graphs
respectively.
to change and delete the selected graphs
respectively.
|
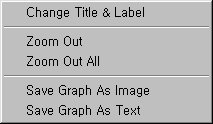
Right click on the graph displayed on the screen to prompt the following Context Menu. |
|
|
|
Change
Title & Label Zoom
Out Zoom
Out All Save
Graph As Image Save
Graph As Text |
StagesSelect a construction stage for which graphic and text results are displayed.