Produce the time history graphs representing the analysis results of
individual nodes resulting from Heat of Hydration stage analysis.
From the Main
Menu select Results
> Heat of Hydration Analysis > Graph.
Select Results >
Heat of Hydration Analysis > Graph in the Menu
tab of the Tree
Menu.
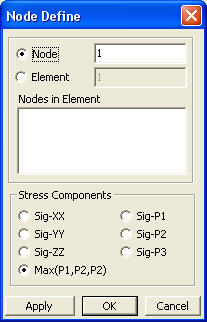
Define Nodes
Specify the nodes and the direction components
of stresses for which the time history analysis results of heat of hydration
analysis are produced.
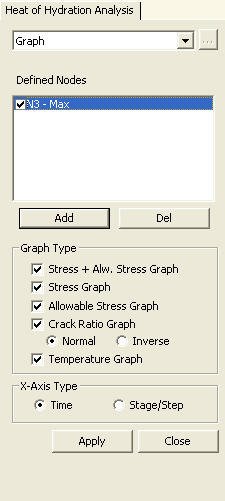
Graph Type
Select the types of analysis results for
producing time history graphs for the selected nodes.
Stress +
Alw. Stress Graph: Time history graphs for resulting stresses and
allowable stresses
Stress Graph:
Time history graphs for resulting stresses
Allowable
Stress Graph: Time history graphs for allowable stresses
Crack Ratio
Graph: Time history graphs for the ratios of the allowable stresses
to resulting stresses (crack ratios)
Normal:
Allowable stress / Resulting stress
Inverse:
Resulting stress / Allowable stress
Temperature
Graph: Time history graphs for temperatures at individual nodes
If is clicked
Add additional nodes for graphs.
Select node numbers and stress components.
Sig-XX:
Stress component in the X-direction of the Global coordinate system
Sig-YY:
Stress component in the Y-direction of the Global coordinate system
Sig-ZZ:
Stress component in the Z-direction of the Global coordinate system
Max(X,Y,Z):
The maximum value of the stress components in the Global coordinate system
X-Axis Type
Time:
Produce the graphs relative to time.
Stage /
Step: Produce the graphs by construction stages/steps.
Context Manu
Right click on the graph displayed on the
screen to prompt the Context Menu. Numerous techniques for displaying
the graph, saving data, and saving image is possible by using the context
menu.
Change
Title & Label
Modify the title and label of a graph.
Define
Graph Origin/Resolution/Range...
Modify the functions for displaying the graph, such as graph origin, resolution,
range, etc.
Zoom Out
& Zoom Out All
By dragging the mouse on the graph, the user can zoom in and out.
X &
Y Axis Log Scale
The X & Y-axis of the graph is converted to Log Scale. Executing once
again restores to the original state. (Toggle).
Save Graph
As Image
Save the graph in the graphic file format of BMP, JPG or EMF. (default=BMP
image).
Save Graph
As Text
Save the data in a text file.
Save Graph
As Excel
Save the data in a MS-Excel file
Note
For X-Axis Type Stage/Step, the Define Graph Origin/Resolution/Range function
does not apply.
 Define Nodes
 If
If  is clicked