Fiber Material Properties
|
|
|
|
|
|
Stress-strain relationships between reinforcing steel and concrete are defined to carry out inelastic time history analysis using Fiber Elements. Each model is unique based on the proponents and specifications. |
|
|
|
|
|
|
|
From the Main Menu select Model > Properties > Fiber Material Properties
Select Geometry > Properties > Fiber Material Properties in the Menu tab of the Tree Menu. |
|
|
|
|
|
Each beam element's cross-section is divided into small fibers, and each fiber cell within the cross-section retains a linear and nonlinear Stress-Strain relationship.
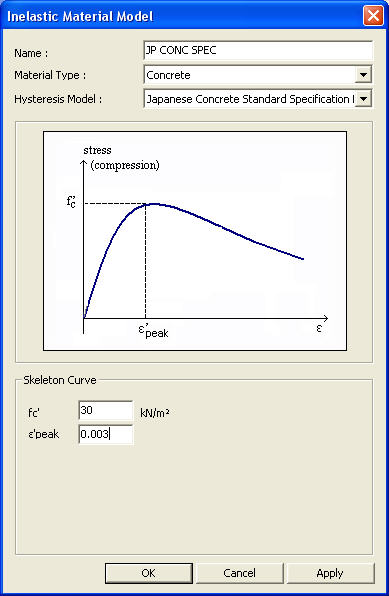
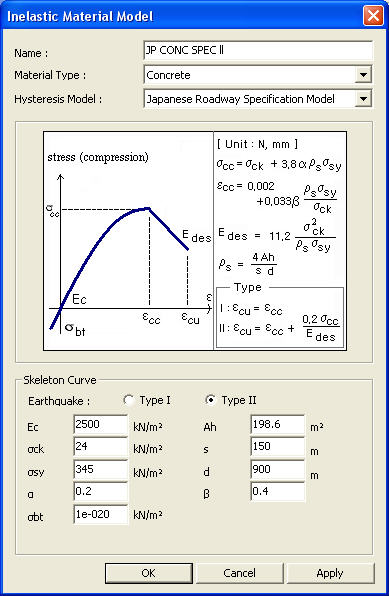
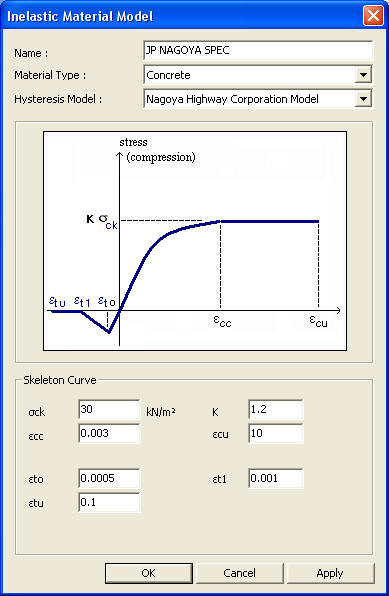
The properties of fiber materials are defined.
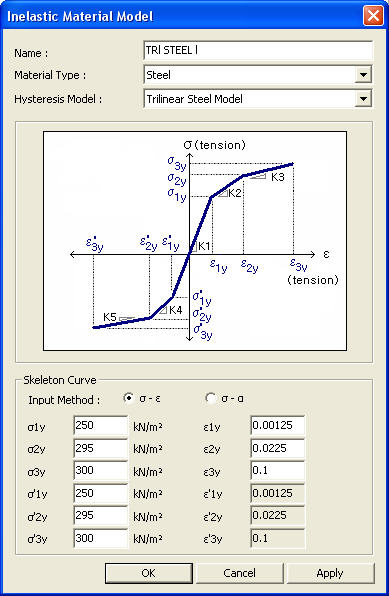
Name: Name of a fiber element model to be defined
Material Type: Steel or concrete for which a hysteresis model will be defined
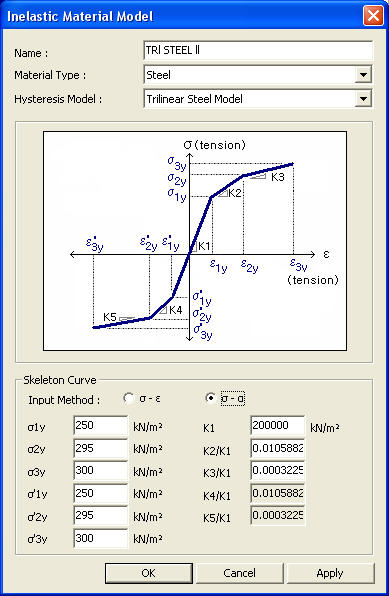
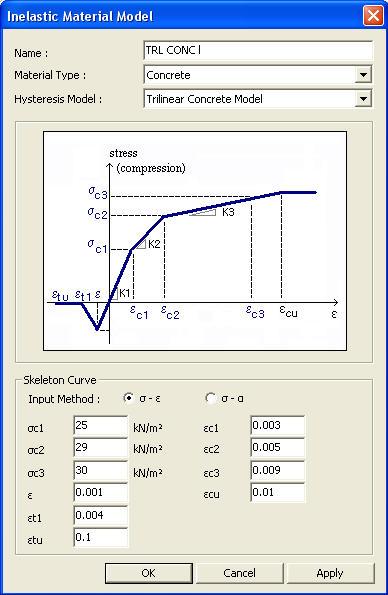
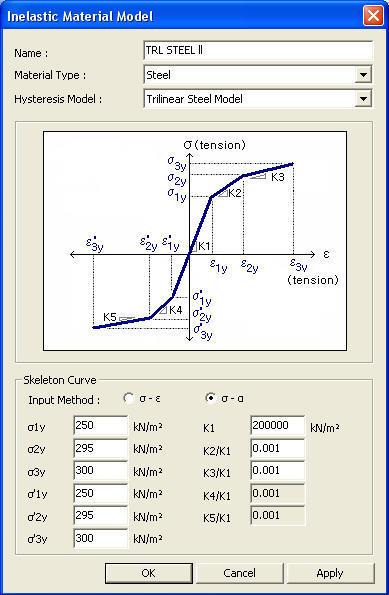
Hysteresis Model: Select a hysteresis model to define a fiber element out of 4 reinforcing steel models and 5 concrete models.
Skeleton Curve: Specify the property values defining the hysteretic behavior of the fiber material following the diagram.
|
|
|
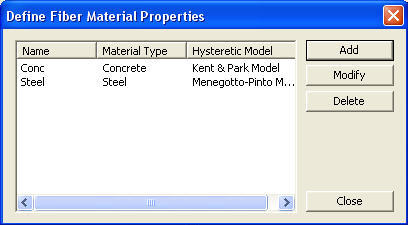
 : Enter or add a new fiber
material property.
: Enter or add a new fiber
material property. : Modify or check a fiber
material property previously defined.
: Modify or check a fiber
material property previously defined. : Delete a fiber material
property previously defined.
: Delete a fiber material
property previously defined. Concrete
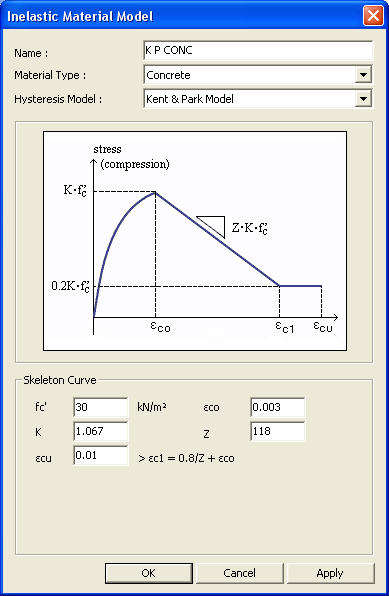
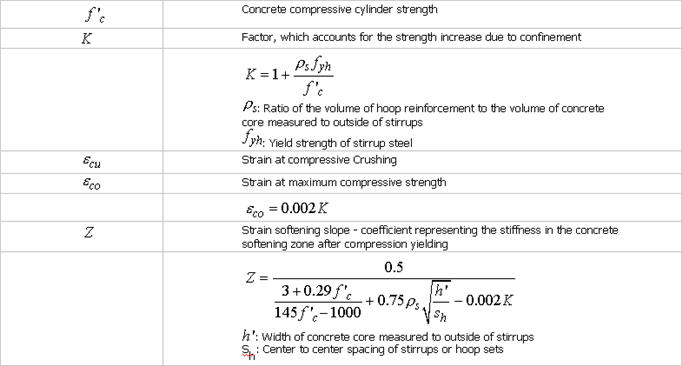
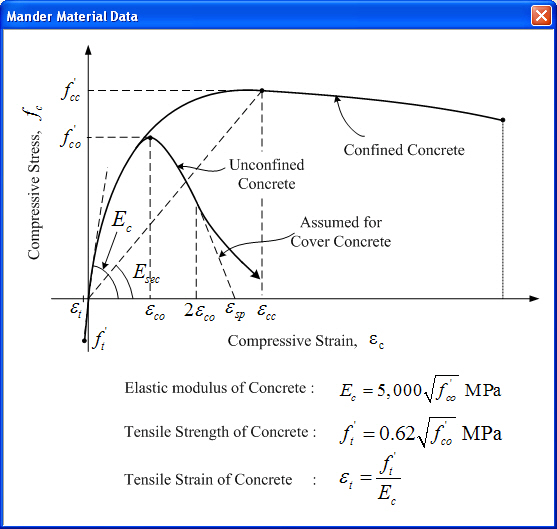
 can be obtained by the proposed equation of Scott et al,
or another value may be used at user's discretion.
can be obtained by the proposed equation of Scott et al,
or another value may be used at user's discretion.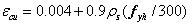
 and
and  ;
;
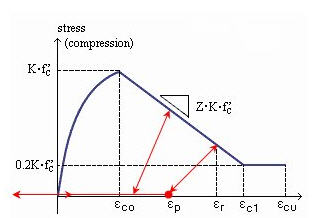
 : Compressive strength of
concrete cylinder
: Compressive strength of
concrete cylinder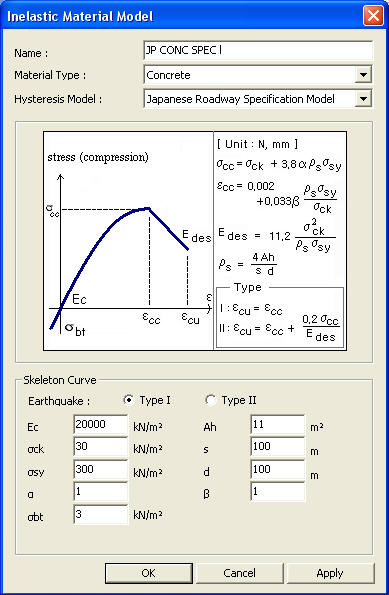
 Revision of Gen 2010
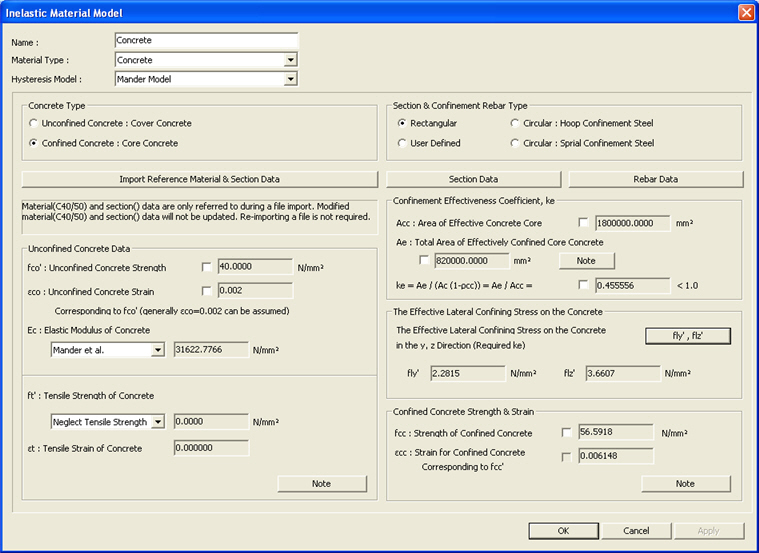
 : Define the core concrete dimension and confinement rebar
spacing, etc.
: Define the core concrete dimension and confinement rebar
spacing, etc.  : Define the longitudinal rebar and confinement rebar related
data.
: Define the longitudinal rebar and confinement rebar related
data. 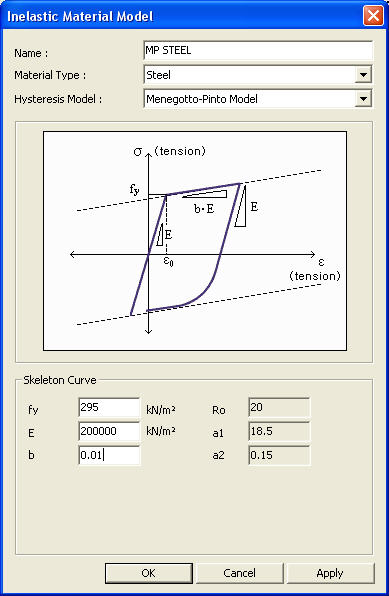
 and
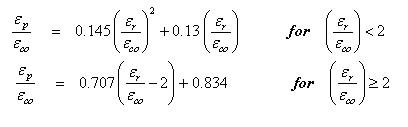
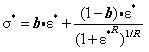
and  are normalized values and are calculated as follows:
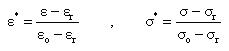
 is
a point intersected by two asymptotes.
is
a point intersected by two asymptotes.  is
the point where the last unloading occurred. While unloading and reloading,
these points are updated, so that the transition curve is affected.
is
the point where the last unloading occurred. While unloading and reloading,
these points are updated, so that the transition curve is affected. 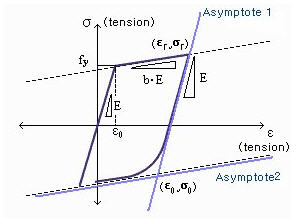
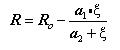
 are
determined from experimental hysteresis results. MIDAS uses 18.5, 0.15
and 20, respectively, as default values. These default values are suggested
in the original reference (Menegotto and Pinto,1973).
are
determined from experimental hysteresis results. MIDAS uses 18.5, 0.15
and 20, respectively, as default values. These default values are suggested
in the original reference (Menegotto and Pinto,1973).  is a shape coefficient and
updated at every unloading.
is a shape coefficient and
updated at every unloading.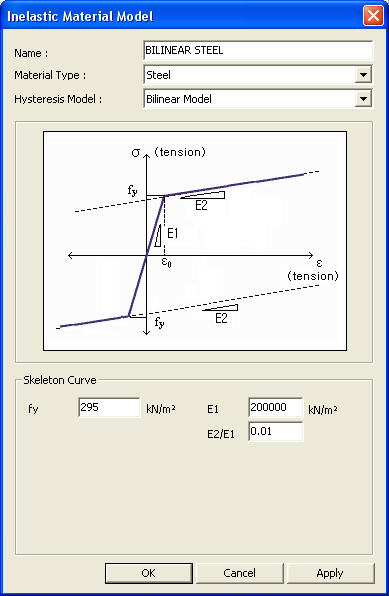
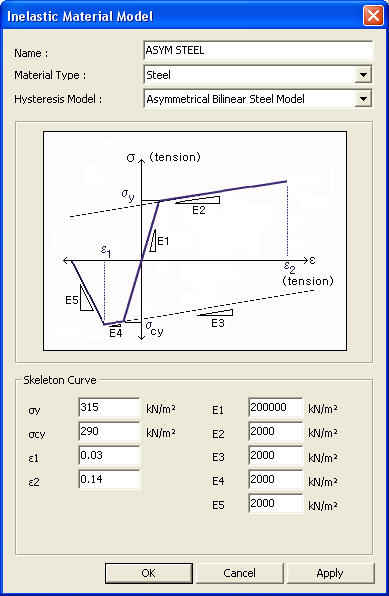
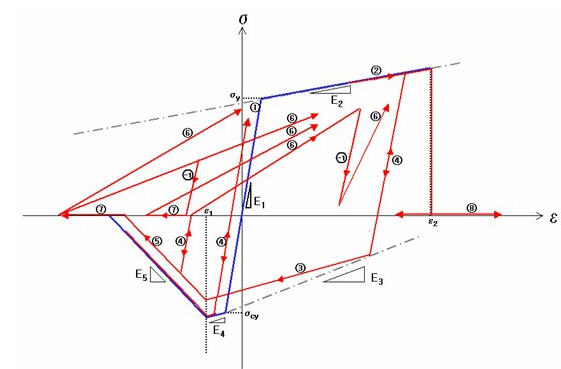
 .
.  and
compression buckling starts. The slope is E5.
and
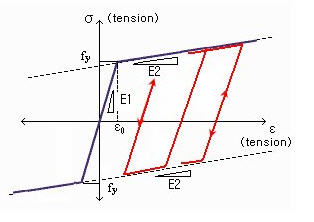
compression buckling starts. The slope is E5.  before tensile yielding
occurs. Reloading will progress towards the maximum point in the tension
zone after tensile yielding occurs.
before tensile yielding
occurs. Reloading will progress towards the maximum point in the tension
zone after tensile yielding occurs.