Plate Cutting Line Diagram


Display the internal forces of plate elements along defined cross sectional lines in a graph.


This functionality allows us to check the analysis results in a desired direction regardless of the element local coordinate system used in creating plate elements.


From the Main Menu select Results > Forces > Plate Cutting Line Diagram.


Select Results > Forces > Plate Cutting Line Diagram in the Menu tab of the Tree Menu.


ClickPlate Cutting Line Diagram in the Icon Menu.


  •  

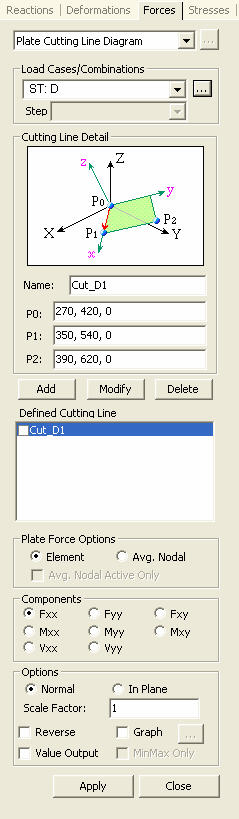
    Load Cases/Combinations


    Select a desired load case, load combination or envelope case.

    Click to the right to enter new or modify existing load combinations. (Refer to "Load Cases / Combinations")


    Step
    Specify the step for which the analysis results are to be produced. The Step is defined in geometric nonlinear analysis as Load Step, and additional steps are defined in the construction stages of bridges or heat of hydration analyses.


    Note 1
    The Construction Stage applicable for the output of the construction stage analysis is defined in Select Construction Stage for Display or Stage Toolbar.


    Note 2

    When pushover analysis is performed for a structure containing Plate, Plane Stress or Solid elements, the pushover analysis results for Plate, Plane Stress or Solid elements can be produced by Steps.


    Cutting Line Detail


    Define coordinate systems, which will become the bases for producing the internal forces of plate elements.


    Name: Name of a defined cutting line through which a force diagram will be produced


    P0, P1, P2: Coordinates defining the coordinate system


    : Add the defined cutting line to the list.


    : Modify cutting line data registered in the list.


    Saved Menu-Bar Info's: Listed here are the Base Files. Select the Base File Names for Batch Output.


     : Delete all the Base Files selected with the mouse.


    When the construction stage analysis is carried out, all the construction stages are listed. We simply select the stages of interests to be included in the batch output. If no construction stage analysis is performed, the column in the dialog box becomes inactive and lists load (combination) conditions.


    Stages

    The results output of all the construction stages are produced. The construction stages are listed below.


    PostCS Loads

    The results output for only the Final Stage are produced. The construction stages are listed below. If no construction stage analysis is performed, the load (combination) conditions are listed.


    Use Saved

    Apply only the (saved) step or load (combination) condition selected at the time of creating each Base File.


    Stage LCase/LComb

    When the construction stage analysis is carried out, the auto-generated construction stage load conditions and the additionally entered construction stage load combinations are listed. Check on only the load (combination) conditions that will be used to produce batch outputs. This column becomes inactive if  "Final Stage Loads" is selected or no construction stage analysis is carried out.


    Step Option

    Specify the steps for which the outputs will be produced when the construction stage analysis or large displacement geometric nonlinear analysis is performed.


    Saved Step: Use only the steps used for creating the Base Files


    All Steps: Use all the steps


    : Delete a selected cutting line registered in the list


    Plate Force Options


    Element: Display the contour using the internal forces calculated at each node of an element.


    Avg. Nodal: Display the contour using the average internal nodal forces of the contiguous elements sharing the common nodes.


    Avg. Nodal Active Only: Execute Avg. Nodal for only currently active elements.


Components


Select the desired internal force component among the following:


Fxx: Axial force per unit width in the element's local or UCS x-direction (Perpendicular to local y-z plane)


Fyy: Axial force per unit width in the element's local or UCS y-direction (Perpendicular to local x-z plane)


Fxy: Shear force per unit width in the element's local or UCS x-y direction (In-plane shear)


Mxx: Bending moment per unit width in the direction of the element's local or UCS x-axis (Out-of-plane moment about local y-

axis)


Myy: Bending moment per unit width in the direction of the element's local or UCS y-axis (Out-of-plane moment about local x-

axis)


Mxy: Torsional moment per unit width about the element's local or UCS x-y plane


Vxx: Shear force per unit width in the direction of thickness of the x-axis direction defined by P0 and P1


Vyy: Shear force per unit width in the direction of thickness of the y-axis direction, which is perpendicular to the x-axis of the corresponding plane


(a) Forces per unit length due to in-plane actions


                       (b) Moments per unit length due to out-of-plane bending actions


Output of plate elements forces per unit length


Options


Define the plane and color for representing the graph.

Normal


In Plane


Scale Factor

Express the graph normal to the plate elements.


Express the graph in the plane of plate elements.


Define the output scale ratio.

Reverse


Graph

Express the graph in the opposite direction.


Produce the diagrams in graph windows.

Prompt the Plate Cutting Diagram Mode dialog box to determine the type of graph window.


Draw graphs

on separate panes: Produce a number of Plate Cutting Line Diagrams in separate graphs.


 All in one pane: Produce a number of Plate Cutting Line Diagrams all in one graph.


X-Axis: Define the X-Axis of the graph.


Distance from Pnt 1: The scale of the X-axis of the graph is drawn following the length of the cutting line starting from the first point.


Global X Coord.: The scale of the X-axis of the graph is drawn on the basis of the cutting line projected on the Global X-axis.


Global Y Coord.: The scale of the X-axis of the graph is drawn on the basis of the cutting line projected on the Global Y-axis.


Global Z Coord.: The scale of the X-axis of the graph is drawn on the basis of the cutting line projected on the Global Z-axis.

Value Output

Produce the output in numerical values.

MinMax
Only

Produce only minimum and maximum values if Value Output is selected.


Note
The 'Cutting Line' option in Cutting Diagram of
Plate force/moment and Plate Cutting Line Diagram differ in the following aspects:


1) When 'Cutting Line' of Cutting Diagram is executed after selecting 'Local' of Plate Force Option in Plate Forces/Moments,


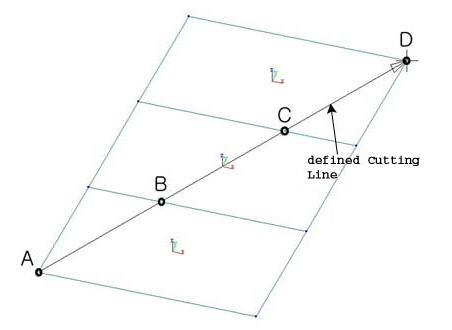
In this case, the plate forces in ECS x or y axis can be obtained at the intersections between the plate elements and the Cutting Line at A, B, C & D. The limitation is that only a single force component or contour can be checked.


2) When Cutting Line' of Cutting Diagram is executed after selecting 'UCS' of Plate Force Option in Plate Forces/Moments


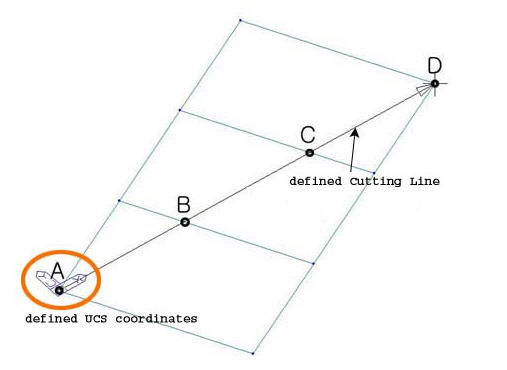
Similar to the case 1 above, the plate forces can be obtained but in UCS, which is defined in advance in the directions of force components of interests.


3) When Plate Cutting Diagram is executed, force components can be obtained in any desired coordinate system

This eliminates predefining UCS as in the case 2 above. However, contour is not provided in this function.