|
|
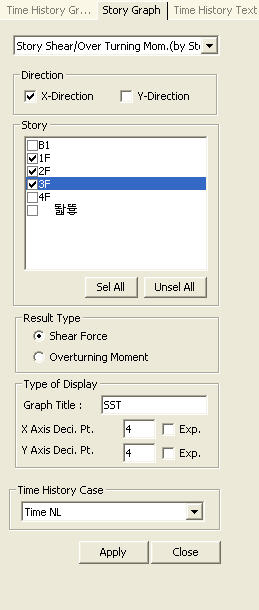
 Story Shear (by Step) / Story Shear (Max.) Story Shear (by Step) / Story Shear (Max.)
Produce story shear forces for each analysis
step of time history analysis and the maximum story shear force for each
story level.
If
Story Shear (by Step) is selected
Direction
Specify a direction of story shear forces.
X-Direction
Y-Direction
Story
Select the stories for which story shear
forces will be produced.
 : Select all stories : Select all stories
 : Unselect all the selected
stories. : Unselect all the selected
stories.
|
Type
of Display
Enter a title of the time history graph and
a format of output for axes.
Graph Title:
Title of time history graph
X-Axis Deci.
Pt. (Exp): Decimal points and whether to express in exponents for
X-axis of the graph
Y-Axis Deci.
Pt. (Exp): Decimal points and whether to express in exponents for
Y-axis of the graph
Time History Case
Select a load case for which a time history
graph will be produced.
If Story Shear (Max.)
is selected
Direction
Specify a direction of story shear forces.
X-Direction
Y-Direction
Min/Max
Min:
Display the minimum story shear force for each story level.
Max:
Display the maximum story shear force for each story level.
Abs. Max:
Display the maximum absolute story shear force for each story level.
Type of Display
Enter a title of the time history graph and
a format of output for axes.
Graph Title:
Title of time history graph
Time History Case
Select a load case for which a time history
graph will be produced.
|