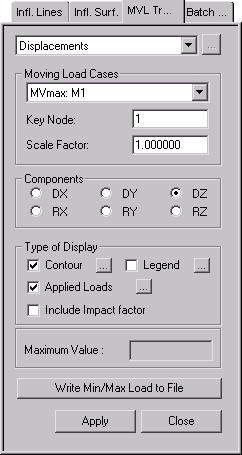
Displacements
| ||||||||||||||||
|
| ||||||||||||||||
|
| ||||||||||||||||
|
While analyzing influence lines or influence surfaces due to traffic loads, trace and graphically display the vehicle loading condition (corresponding moving load case and location) that results in the maximum/minimum displacement of a node. The loading condition is converted into a static loading and produced as a model file of the MCT type. This is an extremely useful feature when we wish to find the loading condition that creates the maximum or minimum displacement. | ||||||||||||||||
|
| ||||||||||||||||
|
| ||||||||||||||||
|
| ||||||||||||||||
|
From the Main Menu select Results > Moving Load Tracer > Displacements.
Select Results > Moving Load Tracer > Displacements in the Menu tab of the Tree Menu. | ||||||||||||||||
|
| ||||||||||||||||
|
| ||||||||||||||||
|
|
Contour |
Display the contour of the influence line/surface together with the vehicle loading condition. |
|
|
Ranges: Define the contour ranges.
Note
Number of
Colors: Assign the number of colors to be included in the contour
(select among 6, 12, 18, 24 colors) Colors: Assign or control the colors of the contour.
Color Table: Assign the type of Colors.
Reverse Contour: Check on to reverse the sequence of color variation in the contour.
Contour Line: Assign the boundary line color of the contour.
Element
Edge: Assign the color of element edges while displaying the contour. Contour Options: Specify options for contour representation.
Contour Fill
Gradient
Fill: Display color gradient (shading) in the contour.
Draw Contour
Line Only
Mono line: Display the boundaries of the contour in a mono color.
Contour
Annotation
Spacing: Specify the spacing of the legend or annotation.
Coarse Contour
(faster) (for large plate or solid model)
Extrude The option is not concurrently applicable with the Deformed Shape option. Similarly, the option cannot be concurrently applied to the cases where the Hidden option is used to display plate element thicknesses or the Both option is used to represent Top & Bottom member forces (stresses). |

 : Assign the color distribution
range of contour. Using the function, specific colors for specific ranges
can be assigned.
: Assign the color distribution
range of contour. Using the function, specific colors for specific ranges
can be assigned. : Control the colors by zones
in the contour.
: Control the colors by zones
in the contour.|
Legend |
Display various references related to analysis results to the right or left of the working window. |
|
|
Legend Position: Position of the legend in the display window
Rank Value Type: Specify a type of values in the Legend and the number of decimal points. |
|
Applied Loads |
Graphically display the vehicle load condition for which the analysis results in the max/min displacement. |
|
|
Set a detail display condition for the vehicle load case.
Load Scale Factor: Enter the drawing scale factor for the load representation.
Load Values: Option to display the load values |
|
Include Impact Factor |
Reflect the impact factor in the display. |
 Maximum Value
Produce the maximum or minimum value calculated from the moving vehicle load analysis.
 : Where Influence Line or
Influence Surface analysis has been carried out, the moving load case,
which produces the maximum or minimum results, is converted into a static
loading and produced as an MCT type.
: Where Influence Line or
Influence Surface analysis has been carried out, the moving load case,
which produces the maximum or minimum results, is converted into a static
loading and produced as an MCT type.
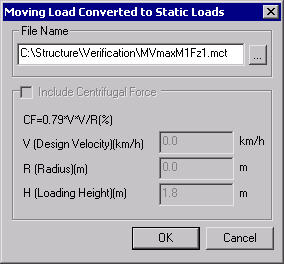
Moving Load Converted to Static Load dialog box
File Name
Enter the file path and name of the MCT file to be output.
Include Centrifugal Force
In the case of a curved bridge include additional loads created by Centrifugal Force in the conversion into the static loading.