|
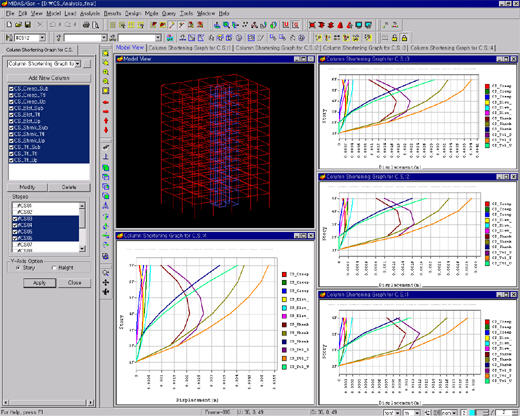
Column
Shortening Graphs
Click  to prompt the following
dialog box, and select the column location and types of graphs. to prompt the following
dialog box, and select the column location and types of graphs.
 Name Name
Enter the name of the graph.
Coordinate Info
Enter the location of the column in the global
coordinates X & Y and allowable tolerance.

Select all the graphs listed below.

Unselect all the graphs listed below.
Note
The results produced from the graphs listed are as follows:
Elastic:
Elastic shortening
Creep:
Creep shortening
Shrinkage:
Shrinkage shortening
Total:
Sum of elastic, creep and shrinkage shortenings
Up to Casting:
Column shortening immediately after casting the slab at the current story
Sub to Casting:
Column shortening subsequent to casting the slab at the corresponding
story
Total:
Sum of column shortenings for Up to Casting and Sub to casting
Upon clicking the  button, the graphs selected above will be listed in
the dialog box. button, the graphs selected above will be listed in
the dialog box.
Select the graphs desired to plot and click
 to plot the graphs on the model screen. Click to plot the graphs on the model screen. Click  and and  to change and delete the selected graphs
respectively. to change and delete the selected graphs
respectively.
|
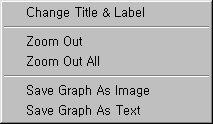
Right click on the graph
displayed on the screen to prompt the following Context Menu. |
|
|
Change
Title & Label
The title and subtitles to the x & y-axes may be changed.
Zoom
Out
Drag the mouse over the part that is of interest to zoom in and click Zoom
Out to restore the view.
Zoom
Out All
Restore the very initial view of the graph. That is, revert to the view
that contains all the ranges.
Save
Graph As Image
Save the graph in the graphic file format of BMP, JPG or EMF.
Save
Graph As Text
Save the graph in the format of a text file. |
Stages
Select a construction stage for which graphic
and text results are displayed.
|