Dx
: Axial component in the element's local x-direction
Dy
: Shear component in the element's local y-direction
Dz
: Shear component in the element's local z-direction
Rx
: Torsional component about the element's local x-axis
Ry
: Bending moment component about the element's local y-axis
Rz
: Bending moment component about the element's local z-axis
Type of Value
Positive
: Display the maximum positive displacement
Negative
: Display the minimum negative displacement
Abs
Max. : Display the absolute maximum displacement
Type of Display
Define the type of display as follows:
Contour
Display the displacement of the model in
contour.
Ranges:
Define the contour ranges.
: Assign the
color distribution range of contour. Using
the function, specific colors for specific ranges can be assigned.
Number of
Colors: Assign the number of colors to be included in the contour
(select among 6, 12, 18, 24 colors)
Colors:
Assign or control the colors of the displacement contour.
Color Table:
Assign the type of Colors.
: Control the colors by zones in the contour.
Reverse
Contour: Check on to reverse the
sequence of color variation in the contour.
Contour
Line: Assign the boundary line color of the
contour
Element
Edge: Assign the color of element edges
while displaying the contour
Contour
Options: Specify options for contour representation
Contour Fill
Gradient
Fill: Display color gradient (shading) in the contour.
Draw Contour
Lines: Display color boundaries in the contour.
Draw Contour Line Only
Display only the colored boundaries of the
contour.
Mono line:
Display the boundaries of the contour in a mono color.
Contour Annotation
Legend or annotation signifying the ranges
of the contour is displayed.
Spacing:
Display the spacing for the legnd or annotation.
Coarse Contour
(faster) (for large plate or solid model)
Represent a simplified contour for a large
model using plate or solid elements in order to reduce the time required
to represent a complete contour.
Extrude
Where plate elements or solid elements along
a cutting plane are represented in contour, a three dimensional contour
is created. The positive direction of the analysis results is oriented
in the z-axis direction of the local element coordinate system. The option
is not concurrently applicable with the Deformed Shape option. Similarly,
the option cannot be concurrently applied to the cases where the Hidden
option is used to display plate element thicknesses or the Both option
is used to represent Top & Bottom member forces (stresses).
Deform
Display the deformed shape of the model.
Deformation Scale Factor
Magnify or reduce the size of the displacement
graphically displayed in the model window.
Deformation Type
Select the type of display for displacement
Nodal Deform:
Display the deformed shape reflecting only the nodal displacements.
Real Deform:
Display the detail deformed shape calculated along the sections between
both ends of beam elements together with the nodal displacements.
Real Displacement
(Auto-Scale off): The true deformation of the structure is graphically
represented without magnifying or reducing it. This option is typically
used for geometric nonlinear analysis reflecting large displacement.
Relative
Displacement: The deformation of the structure is graphically represented
relative to the minimum nodal displacement, which is set to "0"
Values
Display the nodal displacements in numerical
values.
The font and color of the numbers can be
controlled in Display Option.
Decimal
Points: Assign decimal points for the displayed numbers
Exp.:
Express as exponentials
Min &
Max: Display the maximum and minimum values
Abs Max:
Display the absolute maximum value
Max:
Display only the maximum value
Min:
Display only the minimum value
Limit Scale(%):
Set the screen display limit for nodal displacements relative to the selected
maximum or minimum value
Set Orientation:
Display orientation of numerical values
Note
The default Decimal Points can be controlled
in "Preferences".
Set Orientation = 0 horizontally displays
the numerical values to the right of nodes or elements.
The orientation angle represents the counter-clockwise
direction, which may be used to enhance the readability of the numbers.
Legend
Display various references related to analysis
results to the right or left of the working window.
Legend Position:
Position of the legend in the display window
Rank Value
Type: Specify a type of values in the Legend and the number of
decimal points.
Animate
Dynamically simulate the transition process.
Click then click Record
to the right of the Animation control board at the bottom of the working
window.
Animation
Mode: Determine the type of animation for analysis results.
Animate
Contour: Option to change the color of the contour representing
the transition according to the magnitudes of variation
Repeat Half/Full
Cycle: Select the repetition cycle for the dynamic representation
of the transition
Note
Select 'Half Cycle' for the transient shapes
of a structure and 'Full Cycle' for dynamically simulating vibration modes
or buckling modes.
AVI Options:
Enter the options required to produce the animation window.
Bits per
Pixel: Number of bits per pixel to create the default window for
animation
: Assign the method of compressing image data
Frames per
Half Cycle (3~300): Number of frames to simulate a 'Half Cycle'
Frames per
Second (5~60): Number of frames per second to present dynamic simulation
Construction
Stage Option: Select the animation options when the construction
stage analysis is performed.
Stage Animation:
Animations by construction stages
Current
Stage-Step: Animations by Steps in the current construction stage
From ~ To:
Starting and ending construction stages or steps for animations
Start Step
: Enter the starting step for animation.
End Step
: Enter the ending step for animation.
Increment
: Enter the step increment for animation.
: Reset Start Step, End Step
& Increment as default value.
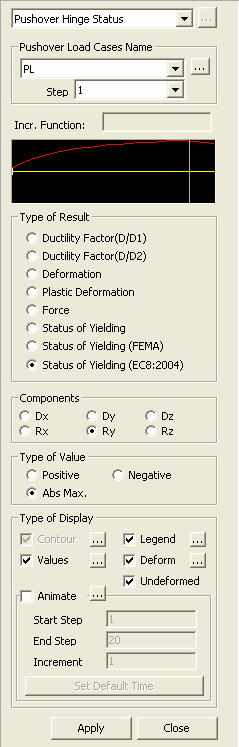
 Pushover Load Case Name
 : Assign the
  : Control the colors by zones in the contour.
 Display Option.
 then click
 Record
to the right of the Animation control board at the bottom of the working
window.
Record
to the right of the Animation control board at the bottom of the working
window. : Assign the method of compressing image data
 : Reset Start Step, End Step
& Increment as default value.
: Reset Start Step, End Step
& Increment as default value.