Pushover Curve
| ||||||||||||||||||||||||||||||||||||||||||||||||||||
|
| ||||||||||||||||||||||||||||||||||||||||||||||||||||
|
| ||||||||||||||||||||||||||||||||||||||||||||||||||||
|
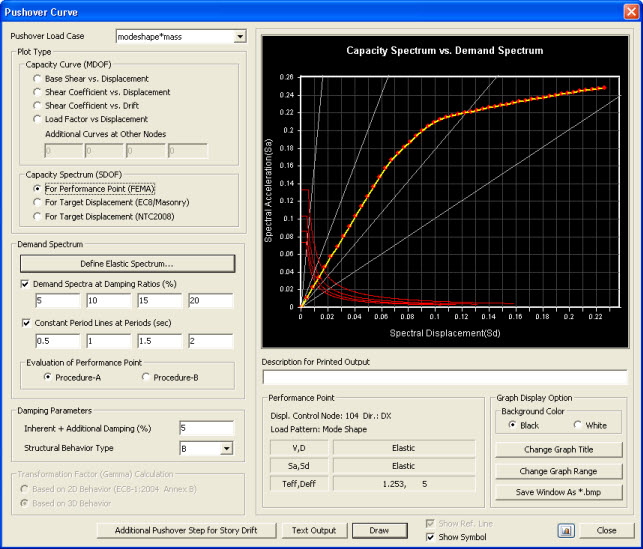
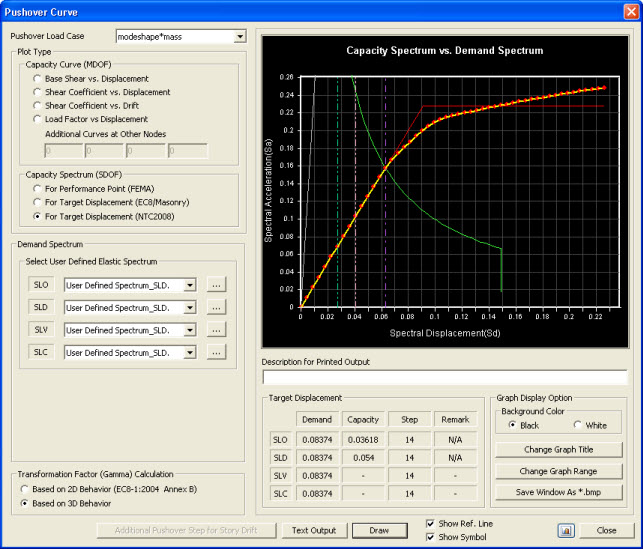
Using the interaction of the base shear and the displacements calculated from the results of a Pushover analysis, the capacity curve and capacity spectrum of a structure are calculated. The demand spectrum is also generated for a design seismic load using the design response spectrum.
The Performance Point, which represents the state of maximum inelastic capacity of the structure, is found through the cross point of the Capacity Spectrum and Demand Spectrum for a given damping ratio. | ||||||||||||||||||||||||||||||||||||||||||||||||||||
|
| ||||||||||||||||||||||||||||||||||||||||||||||||||||
|
| ||||||||||||||||||||||||||||||||||||||||||||||||||||
|
| ||||||||||||||||||||||||||||||||||||||||||||||||||||
|
From the Main Menu select Design > Pushover Analysis > Pushover Curve. | ||||||||||||||||||||||||||||||||||||||||||||||||||||
|
| ||||||||||||||||||||||||||||||||||||||||||||||||||||
|
| ||||||||||||||||||||||||||||||||||||||||||||||||||||
|
Pushover Curve dialog box
| ||||||||||||||||||||||||||||||||||||||||||||||||||||

|
Shaking Duration |
Essentially New Building |
Average Existing Building |
Poor Existing Building |
|
Short |
Type A |
Type B |
Type C |
|
Long |
Type B |
Type C |
Type C |
For example, if 5% is specified for the damping of the structure, the effective damping becomes,
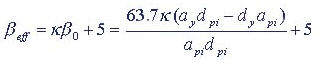
Refer to ATC40 for the definitions of the variables.
 Performance Point
It provides the information on the performance point on the spectrum and the performance point transformed into a multi-degree of freedom system.
V, D
Maximum base shear and maximum displacement of the inelastic structure by the performance point
Sa, Sd
Spectral Acceleration (Sa) and Spectral Displacement (Sd) at the performance point
Teff, Deff
Inelastic effective period and effective damping at the performance point
 Revision of Gen 2011
When Capacity Spectrum (SDOF) : For Target Displacement (EC8 / Masonry) is selected
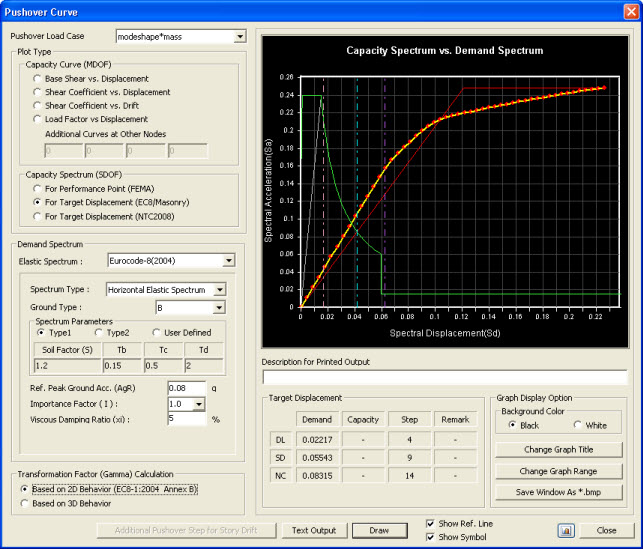 Demand Spectrum
Design Spectrum: Select the design spectrum (i.e.= The elastic response spectrum associated with a reference return period of 475 years) to be applied to calculate the target displacement for the Limit State of Significant Damage (SD).
Eurocode-8(2004)
User Defined: Predefined user-defined response spectrum function can be selected.
Revision of Gen 2011Transformation Factor (Gamma)
CalculationGamma can be calculated in the following two ways:
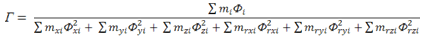
1. Based on 2D Behaviour (EC8-1:2004 Annex B):
2D Behavior is based on EC8 -1 :2004 Annex B and determines the value of gamma by only considering the direction in which pushover analysis is performed .
Hence the value of gamma is :
2. Based on 3D Behaviour: 3D Behavior determines the gamma by considering lateral deflection in all the possible directions.
Hence the value of gamma becomes:
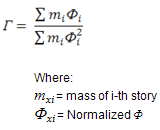
 Target Displacement
 The target displacement of a structure is determined through the transformation to an equivalent single degree of freedom system. For the detailed formula, refer to ANNEX B DETERMINATION OF THE TARGET DISPLACEMENT FOR NONLINEAR STATIC (PUSHOVER) ANALYSIS, EN 1998-1:2004. The target displacement, which is obtained from the above, corresponds to the seismic demand of the Limit State of Significant Damage (SD). Target displacement of the Limit State of Near Collapse (NC) is taken equal to that of SD multiplied by 1.5. Target displacement of the Limit State of Damage Limitation (DL) is taken equal to that of SD divided by 2.5.
Note
When transforming MDOF system to SDOF system, midas applies different modal participation factor to each direction for the 3 dimensional structure. The direction of each mode is determined based on the maximum Modal Participation Mass. For example, if Modal Participation Mass is as follows, Modal Participation Factor for mode 1 and 2 is applied to X-direction and Y-direction, respectively.
Mode
Modal Participation Mass (%)
TRAN-X
TRAN-Y
ROTN-Z
1
66.23
15
3
2
13
60.85
1.06
3
5
7
45
Demand: Roof displacement corresponding to the target displacement for the seismic action is considered. Note that this is the target displacement for the MDOF system, while the vertical lines on the pushover curve represent the target displacements for the equivalent SDOF system.
Capacity: Global capacity of the masonry structure in terms of roof displacement (Master node). Only applicable to Masonry material models.
Global capacity of the Limit State of Significant Damage (SD) is taken equal to the roof displacement at which total lateral resistance (base shear) has dropped below 80% of the peak resistance of the structure, due to progressive damage and failure of lateral resisting elements.
Global capacity of the LS of Damage Limitation (DL) is taken as the minimum value between a) displacement corresponding to the maximum base shear in the pushover curve and b) displacement corresponding to the story drift of 3/1000.
Step: The nearest increment step to the target displacement
Remark: Assessment of the result in terms of the global response for the masonry structure. Only applicable to Masonry material models.
Limit State of SD: The assessment is OK if the global capacity of the Limit State of SD is greater than the target displacement of the Limit State of SD
 and is
less than 3. is
the ratio between the acceleration in the structure with unlimited elastic
behavior
and is
less than 3. is
the ratio between the acceleration in the structure with unlimited elastic
behavior  and
in the structure with limited strength
and
in the structure with limited strength  .
.
Limit State of DL: The assessment is OK if the global capacity of the Limit State of DL is greater than the target displacement of the Limit State of DL (i.e.= Target Displacement of the Limit State of SD divided by 2.5.
Revision of Gen 2011
When Capacity Spectrum (SDOF) : For Target Displacement (NTC 2008) is selected
 Demand Spectrum
Demand Spectrum : The demand spectrum must be defined for each of the limit states.
The demand spectrum can be defined in Load > Response Spectrum Analysis Data > Response Spectrum Functions. User defined Spectrum can also be specified for individual limit states. The target displacement for each of the limit states is determined on the basis of the response spectrum defined for that limit state.
Revision of Gen 2011Transformation Factor (Gamma)
CalculationGamma can be calculated in the following two ways:
1. Based on 2D Behaviour (EC8-1:2004 Annex B):
2D Behavior is based on EC8 -1 :2004 Annex B and determines the value of gamma by only considering the direction in which pushover analysis is performed .
Hence the value of gamma is :
2. Based on 3D Behaviour: 3D Behavior determines the gamma by considering lateral deflection in all the possible directions.
Hence the value of gamma becomes:
Target Displacement Target Displacement:The target displacement of a structure is determined through the transformation to an equivalent single degree of freedom system.
Note
When transforming MDOF system to SDOF system, midas applies different modal participation factor to each direction for the 3 dimensional structure. The direction of each mode is determined based on the maximum Modal Participation Mass. For example, if Modal Participation Mass is as follows, Modal Participation Factor for mode 1 and 2 is applied to X-direction and Y-direction, respectively.
Mode
Modal Participation Mass (%)
TRAN-X
TRAN-Y
ROTN-Z
1
66.23
15
3
2
13
60.85
1.06
3
5
7
45
Capacity Capacity: The capacity is determined for Global Verification and Local Verification.
Capacity for Global Verification: Capacity for Global Verification for limit state SLD is determined as the displacement of the master node ( control node ) for the pushover step when the interstory drift reaches 0.005h. For limit state SLO capacity is determined when the interstory drift becomes greater than 2/3 of 0.005h. The assessment of a structure is done by comparing the capacity and the demand values. The assessment is OK when the capacity is greater than demand.
Additional Pushover Step for Story Drift
Define the additional pushover steps in order to check the pushover analysis results for the steps which have not been defined in Pushover Load Case. [Details…]
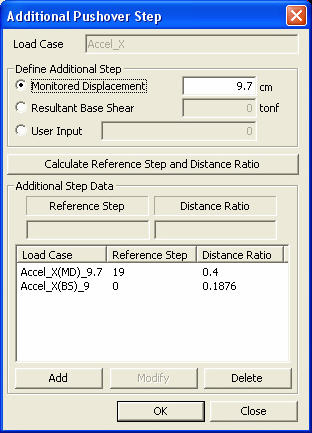
Load Case : The pushover load case defined in Pushover Curve is displayed.
Define Additional Step : Select the method to define additional steps.
Monitored Displacement : Define additional steps based on the displacement.
Resultant Base Shear : Define additional steps based on the base shear.
User Input : Define the additional step name, Reference Step and Distance Ratio directly.
Note Check pushover analysis results for Additional Step
Entered additional step can be checked in Deformed Shape and Story Drift.
Calculate Reference Step and Distance Ratio : Click
 button
in order to define an additional step by entering Distance Ratio from
the Reference Step to the additional step.
button
in order to define an additional step by entering Distance Ratio from
the Reference Step to the additional step.
Additional Step Data : Determine the displacement of additional step
Load Case : Load case name for which an additional step is added.
Reference : Reference pushover step to determine the position of an additional step
Distance Ratio : Displacement ratio of the reference step to the additional step
Text Output
Pushover analysis result graphs can be saved as text files.
Note
When Performance Point is found, an additional step for Performance Point is added in text file.
Draw
Display Capacity Spectrum produced by Performance Point / Target Displacement.
Note
If the user click on Draw button, an additional step for Performance Point is added into Additional Step dialog box.
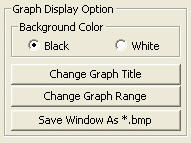
Graph Display Option
|
|
Background Color Set the background color for the plotted graph.
Black: Set the background to black.
White: Set the background to white.
Change Graph Title The graph title can be changed.
Change Graph Range Define the ranges of the X & Y-axes.
Save Window As *.bmp Save the graph in the graphic file format of BMP.
Show Symbol Display each increment steps in Pushover Curve.
Show Reference Line Display the demand corresponding to DL, SD & NC of Target Displacement in Pushover Curve. |