SGSw (Seismic
data Generation System)
extracts and plots graphs of earthquake history records, seismic response
spectrums and design response spectrums using the MIDAS Family Program's
built-in earthquake database
Built-in earthquake history records
- about 30 earthquake records in North America from 1940 until 1990
Extract and plot graphs of earthquake
history records, seismic response spectrums and design response spectrums
using the earthquake database built-in SGSw.
Select to view Toolbar and Status Bar.
Zoom Out a zoomed in view. Convert between time domain and frequency domain
views.
File
Open
Open a previously created SGSw file.
Close
Close the current working window.
Save Save the current data in a file.
The type of the file to be saved can be selected in [File type]. Possible
file extensions are SGS extension for text formats and BMP, JPG and EMF
extensions for graphic formats.
Print
Hard-print the graph. The Page Setup dialog box appears as shown below.
Printing formats can be controlled by Preview displayed to the right.
Click to print.
Print
Setup
Setup the printer, printing form and direction.
Page Setup dialog box
Generate
Earthquake
Acceleration Record
Open an earthquake history record and plot a graph.
Select Generate > Earthquake
Record to display the Earthquake Record Generation dialog
box shown below.
Select an earthquake
component in the Earthquake field. Enter the scales for the amplitude
and time step then click .
All the generated data
are normalized accelerations in g (acceleration of gravity) and the initial
time step is 0.02 sec. Data can also be generated by changing the time
step and amplitude of the original data using the amplitude and time scales.
When data other than the built-in earthquake history records are to be
generated, click to open the data in [.dbs] (sgs dbase
file) extension files generated by the user.
Earthquake Record Generation dialog box
Earthquake
Response Spectra Generation
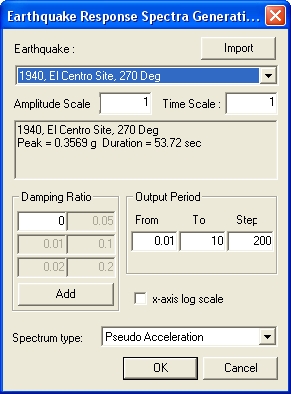
Generate and plot earthquake response spectra from the earthquake history
records built in MIDAS/Gen or the seismic data previously created by the
user.
Earthquake Response Spectra Generation dialog box
Select
an earthquake component in the Earthquake field. Enter the scales of the
amplitude and time step. When data other than the build-in earthquake
history records are to be generated, click to open the data
in [.dbs] (SGS dbase file) extension files generated by the user.
Enter
the damping ratio. When several graphs for different damping ratios are
to be simultaneously plotted, click to add graphs.
Enter
the period range and intervals in Output Period.
Select
the type of spectrum to be generated from Spectrum Type.
Note
Check in the x-axis log scale field to generate the period intervals along
the x-axis in a log scale.
Design Response Spectra
Generate various design
response spectra and plot them in graphs. The detailed menus are as follows:
- UBC 88-94 Design Spectrum: Design response
spectrum specified in UBC 88~94 Dynamic, Uniform Building Code
- UBC 97 Design Spectrum: Design response
spectrum specified in UBC 97 Dynamic, Uniform Building Code
- ATC 3-06 Design Spectrum: Design response
spectrum specified in the ATC 3-06 Provision, Applied Technology Council
- Newmark & Hall Design Spectrum:
Newmark & Hall Design response spectrum
- KS-Code Design Spectrum: Design response
spectrum specified in the Korean Architectural Structures Design Criteria
(1986)
- KS-Code 2000 Design: Design response
spectrum specified in the Korean Architectural Structures Design Criteria
- KS-Bridge Design Spectrum: Design response
spectrum specified in the Seismic Design Criteria of the Korean Highway
Bridges Specifications
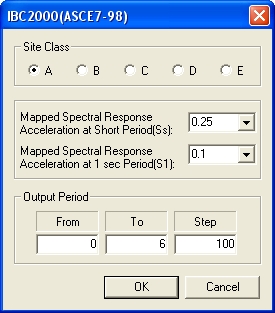
- IBC 2000 Design response spectrum
- Eurocode-8, 1996 Design response spectrum
- China (GB50011-2001) Design response
spectrum
- Japan (AIJ, 2000) Design response spectrum
Select the detailed menu
corresponding to the design response spectrum to be generated to display
the following Design Response Spectrum Data Entry dialog box. Enter the
data necessary to generate the spectrum and click to generate
the data and plot the graph.
Design Response Spectrum Data Entry dialog box
Option
From the Main Menu select
[Option] to display the following detailed menus :
Each sub-menu becomes
inactivated if it deems inapplicable for the current data type.
X Scale
Log: Display the X-axis of the graph in a Log scale.
Y Scale
Log: Display the Y-axis of the graph in a Log scale.
X Grid:
Display gridlines in the X-direction of the graph.
Y Grid:
Display gridlines in the Y-direction of the graph.
Diagonal
Grid: Display gridlines in the diagonal direction of the graph.
Line
Width: Adjust the thickness of graph lines. Convert between bold
and thin lines.
Unit:
Change the units for the generated data.
Edit
Graph Title: Change the title for the graph.
View
From the Main Menu select
[View] to display the following detailed menus:
Note
Each sub-menu becomes deactivated when it deems inapplicable for the current
data type.
Zoom
Out All
When the graph is zoomed in, restore and display the original state. Select
the desired part by left-clicking the mouse to zoom window. Right-click
the mouse in the graph to restore the magnified part to its original size.
Time
↔ Frequency
When viewing the earthquake history records in a graph, the graph can be
converted between the time domain and frequency domain. The frequency
domain plot is calculated by FFT (Fast Fourier Transform).
.jpg)
 File
File to print.
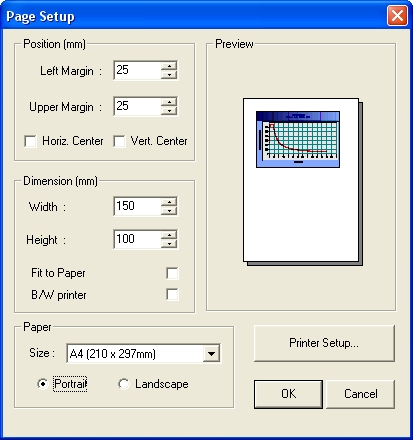
 to open the data in [.dbs] (sgs dbase
file) extension files generated by the user.
to open the data in [.dbs] (sgs dbase
file) extension files generated by the user.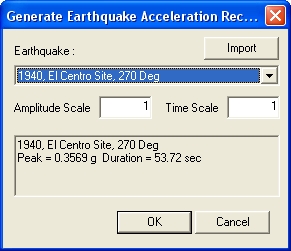
 to add graphs.