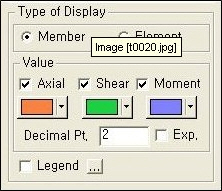
Type of Display
| ||||||||||||||||||
|
| ||||||||||||||||||
|
| ||||||||||||||||||
|
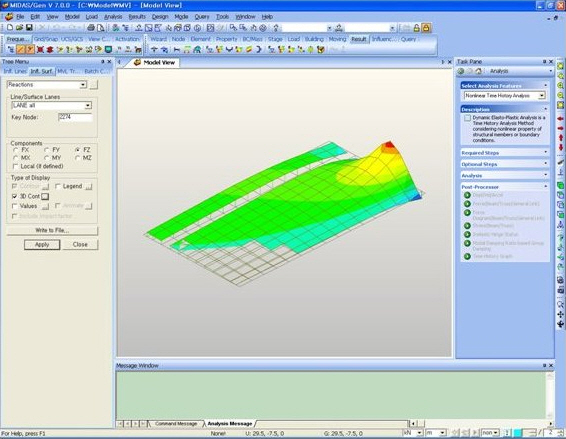
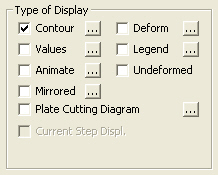
Controls the type of display and allows duplicate application. This function is performed after the results are generated. The user can select any display type for the results.
Type of Display | ||||||||||||||||||
|
| ||||||||||||||||||
|
| ||||||||||||||||||
|
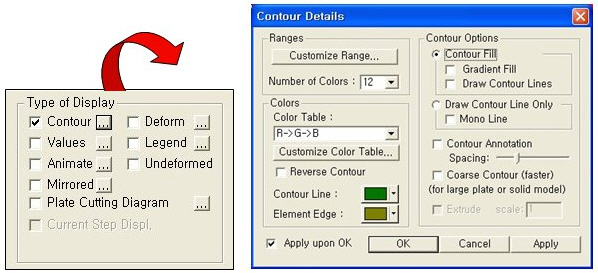
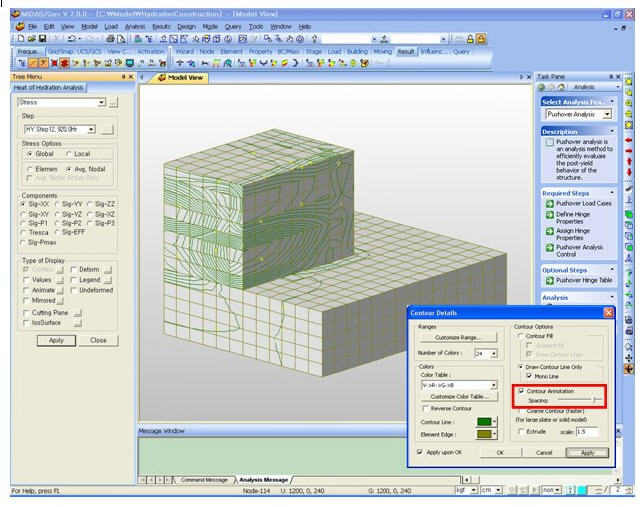
1. Contour: Displays the displacement of the model in contour.
Ranges: Define the contour ranges.
Customize Contour Range
Number of Colors: Selects the number of color to draw the contour. (Select from 6, 12, 18, 24 colors)
Colors
Assign or control the colors of the displacement contour.
Color Tables: Assign the type of Colors.
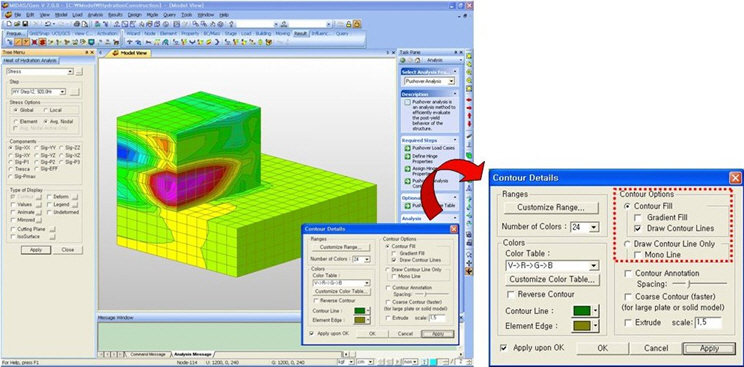
Contour Options: Specifys options for contour representation
Contour Fill
Gradient Fill: Displays color gradient (shading) in the contour.
Draw Contour Lines: Displays color boundaries in the contour.
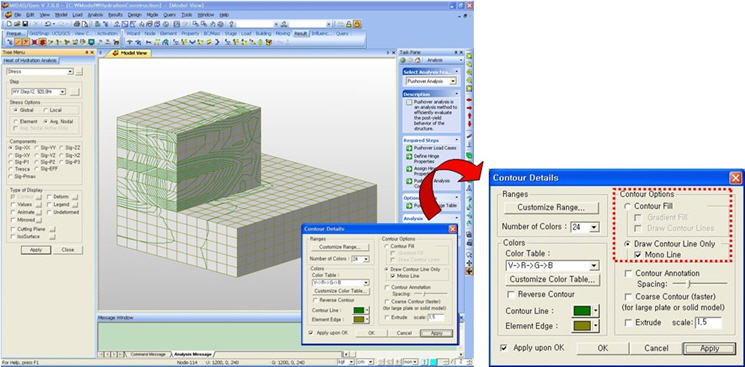
Draw Contour Line Only: Displays only the colored boundaries of the contour.
Mono line: Displays the boundaries of the contour in a mono color.
Contour Fill (Gradient Fill)
Contour Fill (Draw Contour Lines)
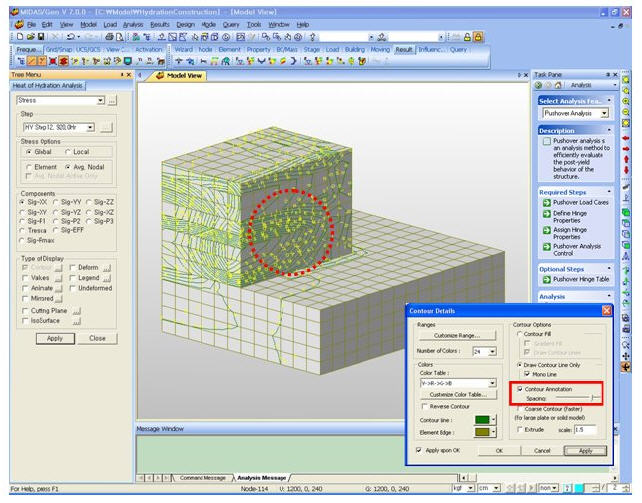
Draw Contour Line OnlyContour Annotation: Displays the legend or annotation signifying the ranges of the contour.
Spacing: Displays the spacing for the legend or annotation.
Contour Annotation SpacingCoarse Contour(faster)(for large plate or solid Model) : Generates a simplified contour for a large model using plate or solid elements in order to reduce the time required to generate a complete contour.
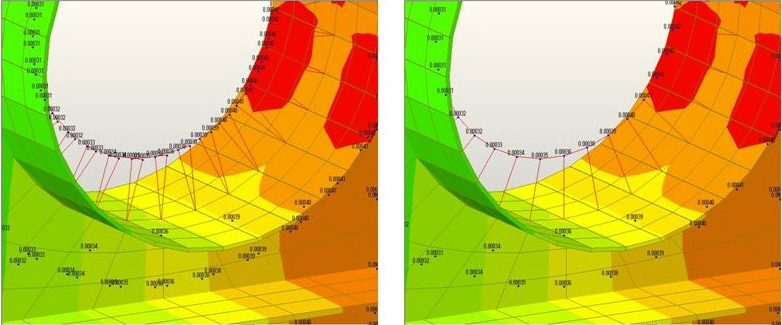
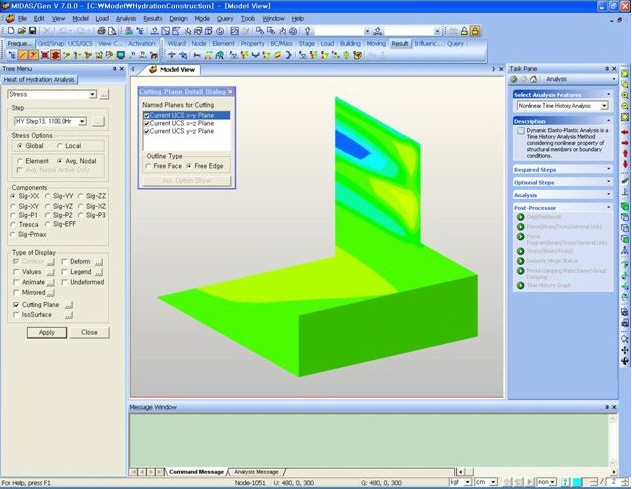
Extrude: Where plate elements or solid elements along a cutting plane are represented in contour form, a three dimensional contour is created. The positive direction of the analysis results is oriented in the z-axis direction of the local element coordinate system.
The option is not concurrently applicable with the “Deformed Shape” option. Similarly, the option cannot be concurrently applied to the cases where the “Hidden” option is used to display plate element thicknesses or the “Both” option is used to represent top and bottom member forces
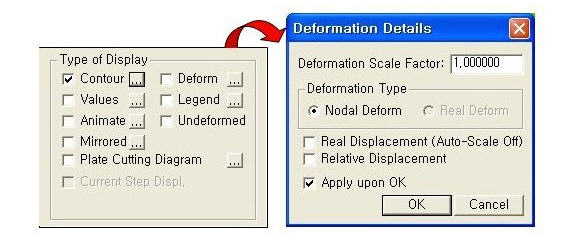
Extrude(2) Deform: Displays the deformed shape of the model.
Deformation DetailsDeformation Scale Factor: Magnifies or reduces the size of the displacement that is graphically displayed in the model window.
Deformation Type: Selects the type of display for displacement.
Nodal Deform : Displays the deformed shape reflecting only the nodal displacements.
Real Deform: Displays the detailed deformed shape calculated along the sections between both ends of beam elements together with the nodal displacements.
Real Displacement(Auto-Scale off): The true deformation of the structure is graphically represented without any magnification or reduction. This option is typically used for geometric nonlinear analysis reflecting large displacements.
Relative Displacement: The deformation of the structure is graphically represented relative to the minimum nodal displacement, which is set to 0.
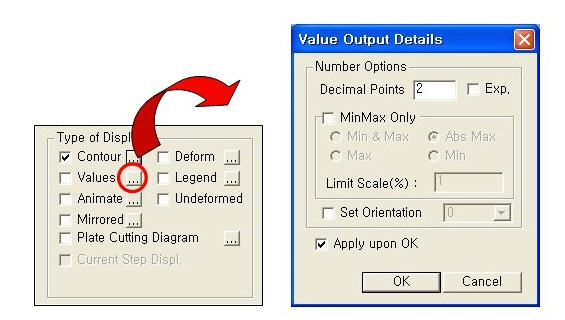
(3) Values: Displays the nodal displacements in numerical values. The font and color of the numbers can be controlled in
Value Output OptionDecimal Points:Selects the decimal point to display.
Decimal Points can be initially settled at Preference.
Exp.: Displays exponential value.
MinMax Only: Displays Min. and Max. value.
Min & Max: Displays Min. and Max. value
Abs Max: Displays the absolute Maximum value.
Max: Displays Maximum value
Min: Displays Minimum value
Limite Scale(%): By selected Minimum and Maximum value this displays every value in (Max-Min)*Limit Scale limit.
Set Orientation : Sets the orientation of the value.
Additional Characteristic Results > Forces > Member Diagrams
Results > Forces > Member Diagrams
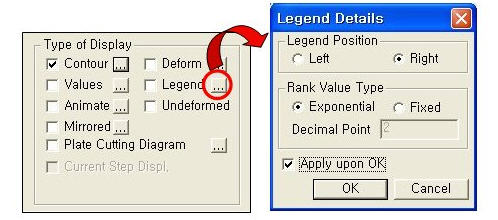
(4) Legend: Displays and reorganizes the results from analysis. Location of the legend can be on either side of the Model View window. Also displays the element number that contains the Max/Min value is.
Legend Details
LegendLegend Position: Position of the legend in the display window
Rank Value Type: Specify a type of values in the Legend and the number of decimal points.
Note If you click on Legend on model view the user can modify Maximum and Minimum Value. If the user changes the value then each range will automatically recalculate and modify.
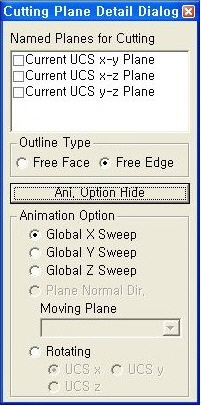
A function to change the limit of Legend(5) Animate: Dynamically simulates the transition process. Click
Animation DetailsAnimate Contour: Option to change the color of the contour representing the transition according to the magnitudes of variation
Repeat Half/Full Cycle : Select the repetition cycle for the dynamic representation of the transition
Note Select 'Half Cycle' for the transient shapes of a structure and 'Full Cycle' for dynamically simulating vibration modes or buckling modes
AVI Options: Enter the options required to produce the animation window.
Bits per Pixel: Number of bits per pixel to create the default window for animation
Frames per Half Cycle : Number of frames to simulate a 'Half Cycle'
Frames per Second : Number of frames per second to present dynamic simulation
Construction Stage Option : Select the animation options when the construction stage analysis is performed.
Stage Animation : Animations by construction stages
Current Stage-Step : Animations by Steps in the current construction stage
From ~ To : Starting and ending construction stages or steps for animations
Only Model Animation: Animates only the model not including any analysis for each construction stage.
Animation functionThe functional icons that controls the animation is as followed
(6) Undeformed : Overlap the un-deformed and deformed shapes of the model.
Undeformed function(7) Mirror: "Mirrored" allows the user to expand the analysis results obtained from a half or quarter model into the results for the full model by reflecting planes
MirrorHalf Model Mirroring:Allows the user to expand the analysis results obtained from a half model to the results for the full model, by reflecting the planes of symmetry.
Quarter Model Mirroring:Allows the user to expand the analysis results obtained from a quarter model to the results for the full model, by reflecting the planes of symmetry.
Mirror by: Specify the mirror plane (s) by designating a plane and a coordinate in the direction perpendicular to the plane in GCS.
Before applying Mirror function
After applying Mirror function- Results > Forces > Beam Diagrams
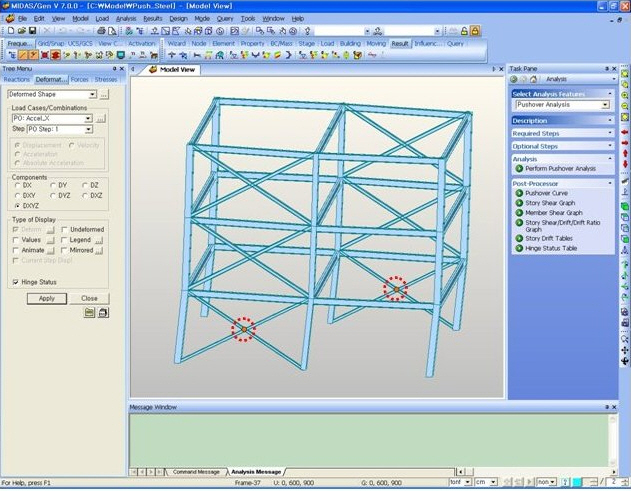
(8) Quick View : The user can check the Shear Force Diagram and the Bending Moment Diagram by the process of detailed beam element analysis. By using P-Delta analysis, the internal displacement for determining the accurate moment is calculated. Note that this only applies to simple beams.
Element: The user can input the element number. The user can also click on the element box then select each element individually by clicking the element in Model View.
Select Load/Step/Comp.
Load Case: Select Load Conditions or Load Combinations for analysis.
Step: Select the step to display the analysis results. The user can define Additional Step in nonlinear geometry analysis or construction stage analysis of high-rise buildings or heat of hydration analysis
Note To select the construction stage to display, the user can specify the construction stage at Select Construction Stage for Display or on the Stage Toolbar.
Component : Select the force components of the element from the followings:
Fx: Force component in local coordinate system x-direction.
Fy: Shear component in local coordinate system y-direction.
Fz : Shear component in local coordinate system z-direction.
Mx: x-axis torsional moment in local coordinate system.
My: y-axis torsional moment in local coordinate system.
Mz : z-axis torsional moment in local coordinate system.
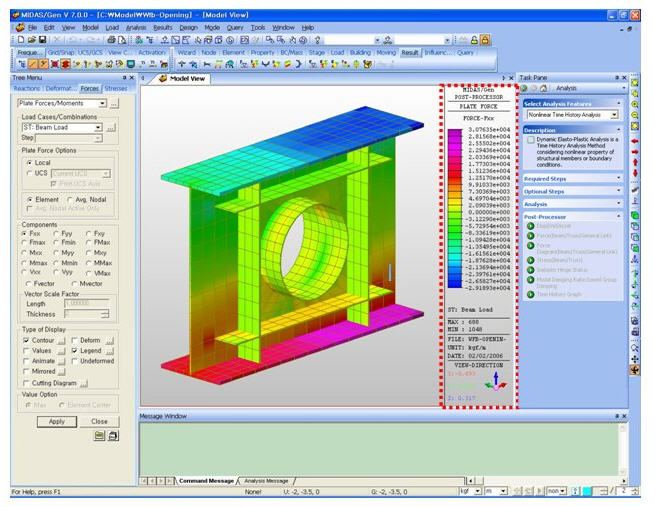
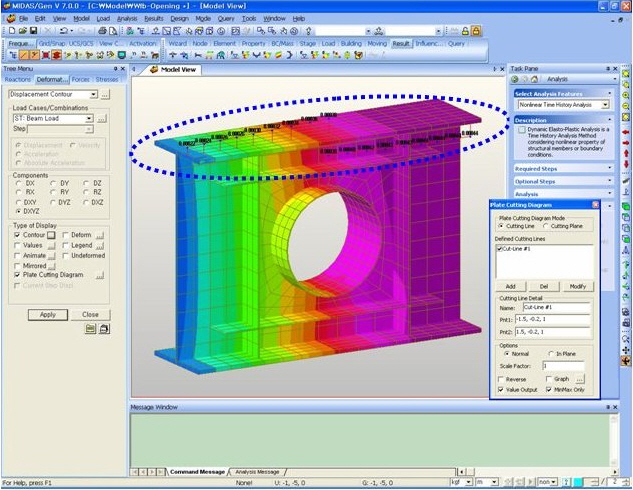
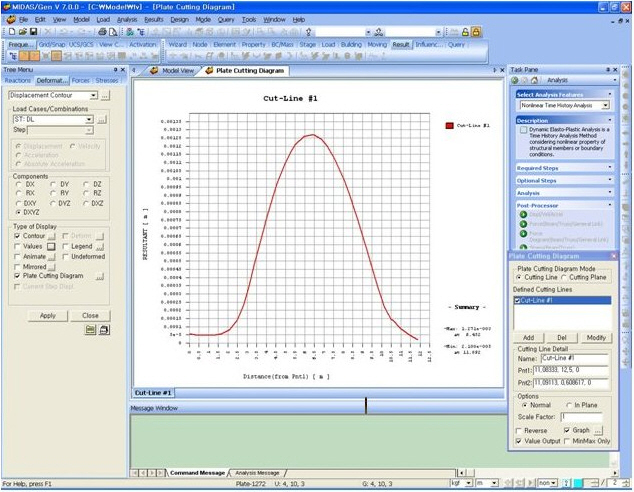
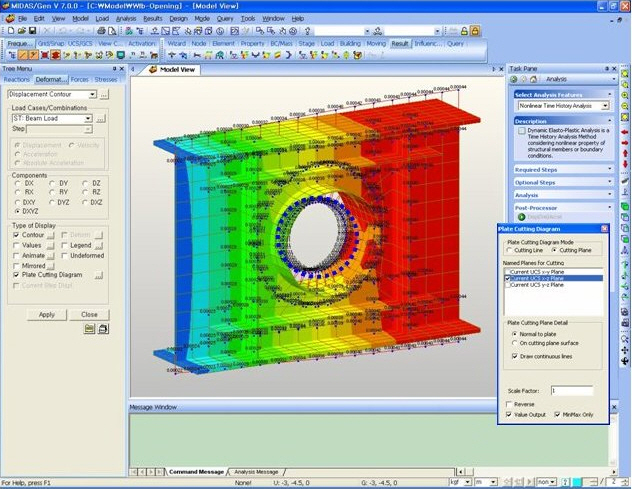
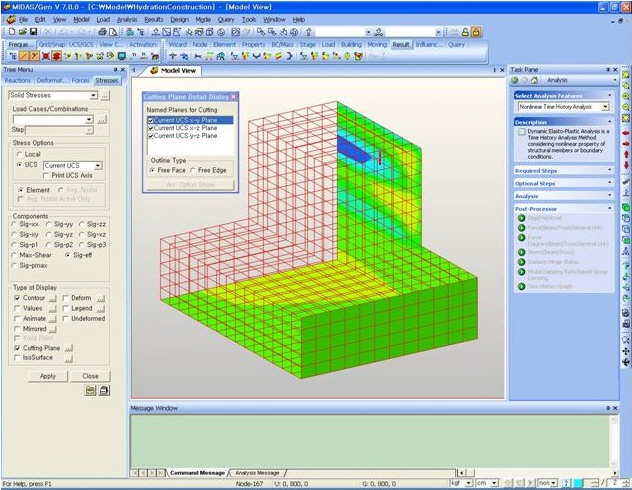
Quick View(9) Plate Cutting Diagram : Displacement of plate elements is generated as a graph along a specific line or plane cut through the elements. The following dialog box is used to specify the conditions required to generate the displacement diagram along the cutting line/plane.
Plate Cutting Diagram
| ||||||||||||||||||
|
|
 : Assign the color distribution
range of contour. Using the function, specific colors for specific ranges
can be assigned.
: Assign the color distribution
range of contour. Using the function, specific colors for specific ranges
can be assigned.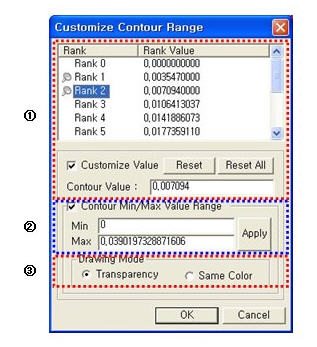
 : Control the colors by zones
in the contour.
: Control the colors by zones
in the contour.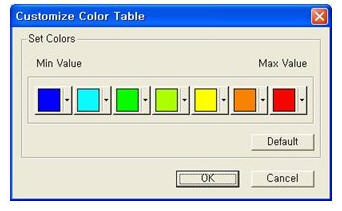


 :This tab defaults the value which were modified.
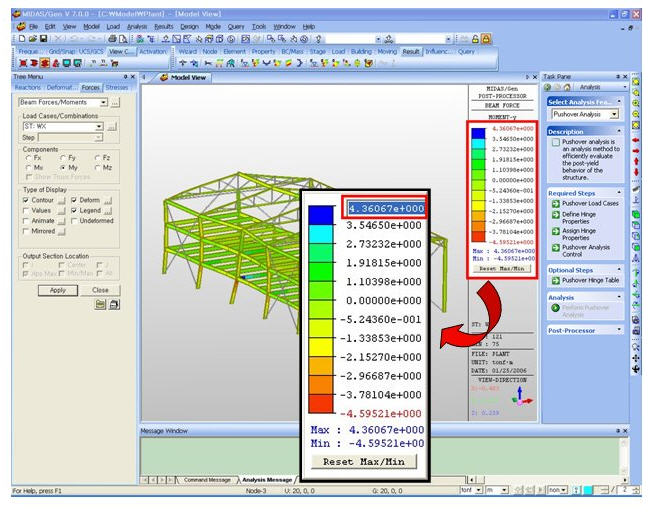
 then click
  Record to the right of the Animation
control board at the bottom of the working window
Record to the right of the Animation
control board at the bottom of the working window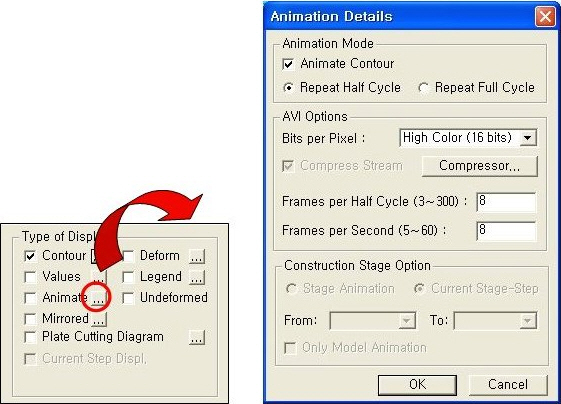
 Assign the method of compressing image data
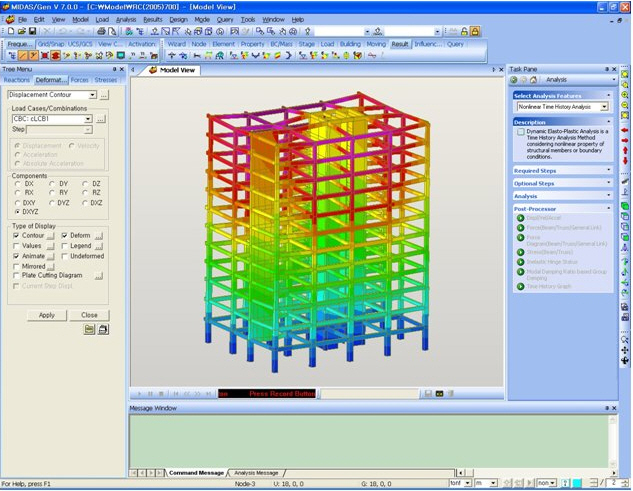
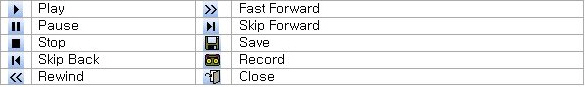
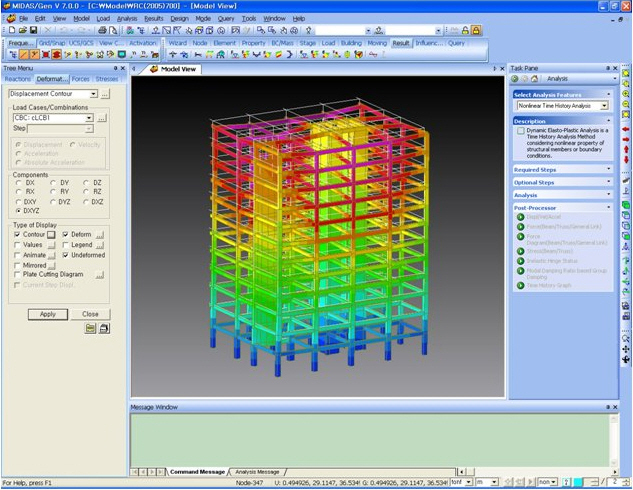
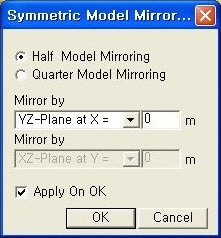
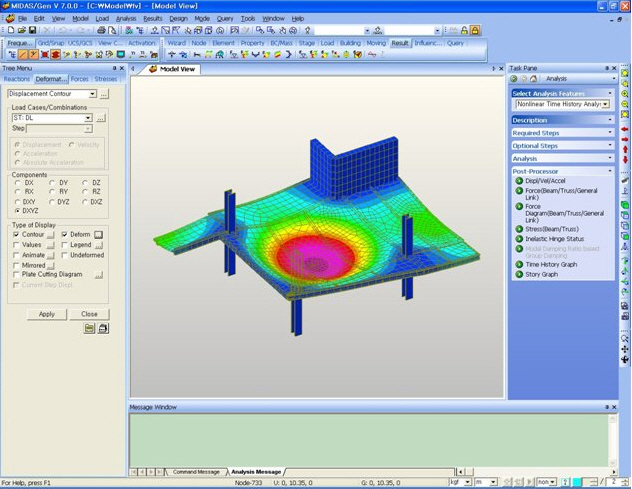
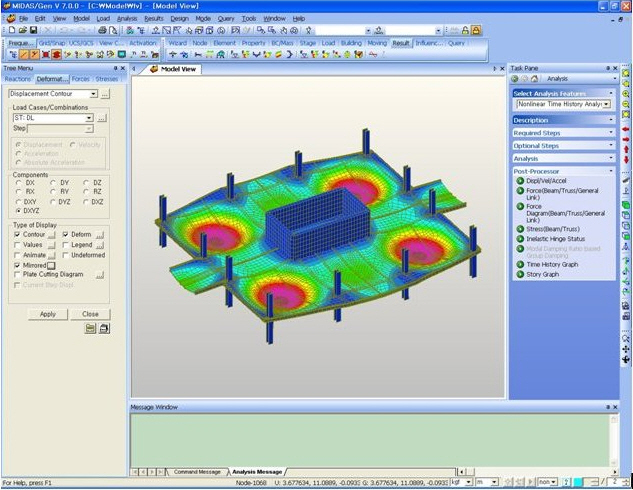
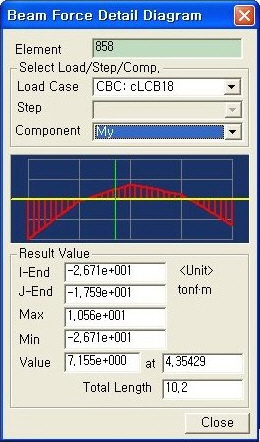
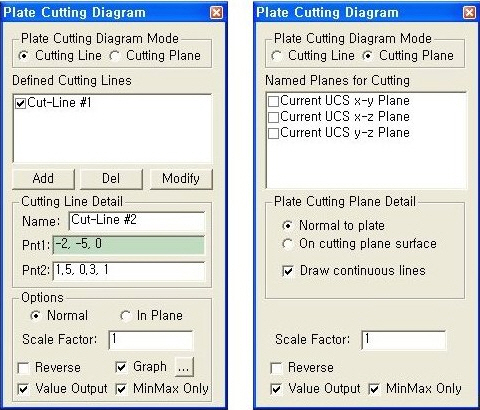
 Plate Cutting Diagram Mode
 :
Add information contained in the Cutting Line Detail to the list of Defined
Cutting Lines
:
Add information contained in the Cutting Line Detail to the list of Defined
Cutting Lines : Delete a defined Cutting
line
: Delete a defined Cutting
line : Modify a defined Cutting
line
: Modify a defined Cutting
line 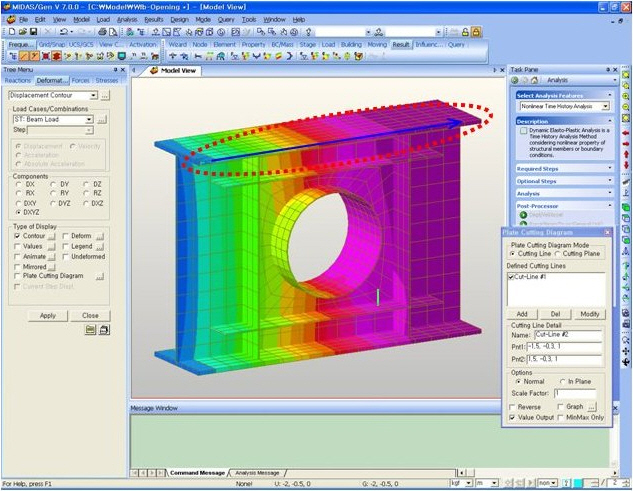
 : Click the button to delete data entries.