Slab Serviceability Checking
| ||||||||||||||
|
| ||||||||||||||
|
| ||||||||||||||
|
Produce the serviceability check results for slabs. | ||||||||||||||
|
| ||||||||||||||
|
| ||||||||||||||
|
| ||||||||||||||
|
From the Main Menu select Design > Meshed Slab/Wall Design > Slab Serviceability Checking. | ||||||||||||||
|
| ||||||||||||||
|
| ||||||||||||||
|
Stress Checking: Display the stress results in contour
Concrete: Display the compressive stress in the concrete
Reinforcement: Display the tensile stress in the reinforcement
Crack control: Display the crack results in contour
Crack Width: Display the value of crack width
Min As: Display the minimum area of rebar
Rebar Spacing: The minimum rebar spacing
Rebar Dia: The maximum rebar diameter
Deflection: Display the deflections
Uncracked: Calculate the deflection for the uncracked section and compare it with the allowable deflection.
Cracked: Calculate the deflection for the cracked section based on the cracked section analysis results and compare it with the allowable deflection.
Note 1 Cracking deflection can be evaluated after executing Perform Cracked Section Analysis.
Note 2 How to calculate the effective moment of inertia Members which are expected to crack, but may not be fully cracked, will behave in a manner intermediate between the uncracked and fully cracked conditions and, for members subjected mainly to flexure, an adequate prediction of behavior is given by the following expression based on the sub clause 7.4.3 (3) in EN 1992-1-1:2004. Following factors including the effective moment of inertia by elements for each iteration step can be checked in "File Name_CSA.OUT" file.
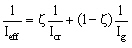
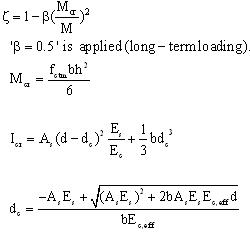
Therefore Ieff (effective moment of inertia) can be calculated from the following equation.
Where,
Creep: Long-term deflection due to creep effect
Value: Display the values of the check results
Ratio: Display the ratio of the member force to the resistance
|
 New for Gen 2010
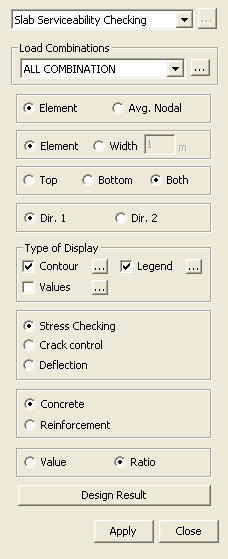

 to
the right to enter new or modify existing load combinations. (Refer to
"Static Load Cases / Combinations")
to
the right to enter new or modify existing load combinations. (Refer to
"Static Load Cases / Combinations")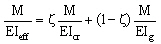
|
Contour |
Display the slab flexural design results of the model in contour. |
|
|
Ranges: Define the contour ranges.
Note Number
of Colors: Assign the number of colors
to be included in the contour (select among 6, 12, 18, 24 colors) Colors: Assign or control the colors of the displacement contour.
Color Table: Assign the type of Colors.
Reverse Contour: Check on to reverse the sequence of color variation in the contour.
Contour Line: Assign the boundary line color of the contour
Element
Edge: Assign the color of element edges while displaying the contour Contour Options: Specify options for contour representation
Contour Fill
Gradient
Fill: Display color gradient (shading) in the contour.
Draw Contour
Line Only
Mono line: Display the boundaries of the contour in a mono color.
Contour
Annotation
Spacing: Display the spacing for the legnd or annotation.
Coarse Contour(faster) (for large plate or solid
model)
Extrude The option is not concurrently applicable with the Deformed Shape option. Similarly, the option cannot be concurrently applied to the cases where the Hidden option is used to display plate element thicknesses or the Both option is used to represent Top & Bottom member forces (stresses). |

 : Assign the color distribution
range of contour. Using the function, specific colors for specific ranges
can be assigned.
: Assign the color distribution
range of contour. Using the function, specific colors for specific ranges
can be assigned. : Control the colors by zones
in the contour.
: Control the colors by zones
in the contour.|
Values |
Display the slab flexural design results
in numerical values. |
|
|
Decimal
Points: Assign decimal points for the displayed numbers Min &
Max: Display the maximum and minimum values Set Orientation: Display orientation of numerical values
Note |

|
Legend |
Display various references related to analysis results to the right or left of the working window. |
|
|
Legend Position: Position of the legend in the display window
Rank Value Type: Specify a type of values in the Legend and the number of decimal points. |