Dynamic Report
Generate a report using analysis and design results from midas Gen. All the input and output data can be plotted (ie. material properties, section properties, reactions, member forces, displacements, stresses, section verification results, etc.) in a diagram, graph, text, or table format. All of the data entered in the report can be modified and saved by the user in MS Word format without any limitations. Also, the user can open and modify the pre-generated report or any other report in MS Word format.
Using the Dynamic Report Regenerator, we can easily update contents of the report by reflecting changes in a model file.
Note System Requirements
From the Main Menu select Tools > Smart Report > Report Generator.
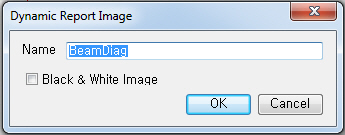
From the Main Menu select Tools > Smart Report > Report Image.
From the Main Menu select Tools > Smart Report > Report Auto Regeneration.
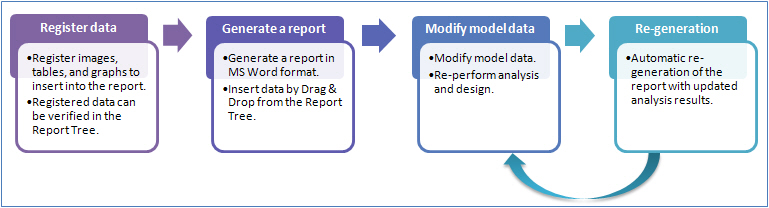
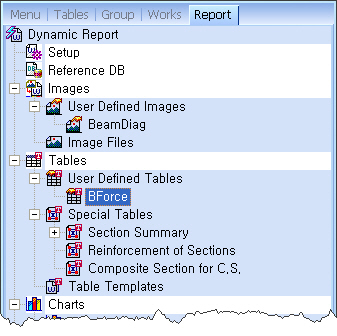
This page consists of 1) Register data, 2) Generate a report, 3) Modify model data and re-generate a report, and 4) Report Tree.
Register contents to be inserted
in a report. The following data format can be inserted: ![]() Images,
Images, ![]() Tables,
Tables, ![]() Charts,
and
Charts,
and ![]() Text.
Text.
Once we register
the desired contents (![]() Images,
Images, ![]() Tables,
Tables,
![]() Charts, and
Charts, and ![]() Text) to the Report Tree, we can generate
a dynamic report.
Text) to the Report Tree, we can generate
a dynamic report.
Generate a report
Click Tools > Dynamic Report Generator from the Main Menu.
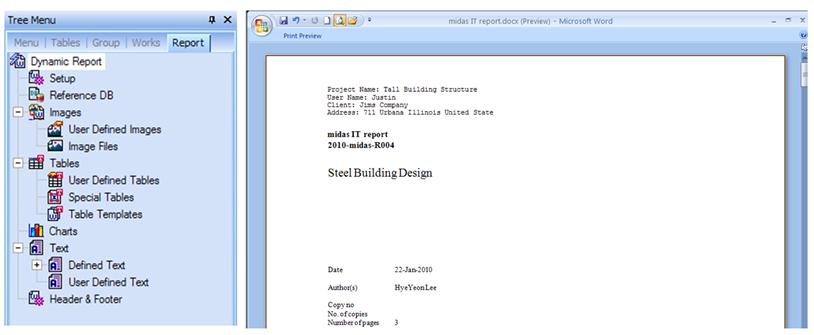
New Document : Generate a new report.
Open Document : Open the pre-generated report.
Insert registered data to the report
There are two methods to insert the registered data into the report.
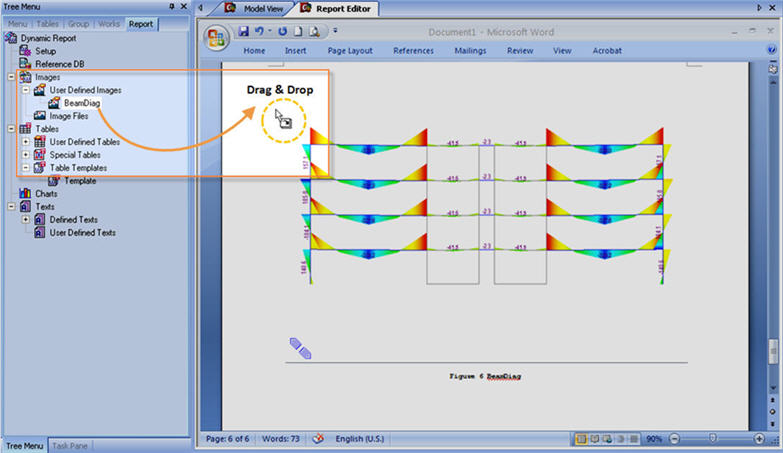
Method 1. Click the desired data from the Report Tree and then Drag & Drop to Report Editor as shown in the figure below.
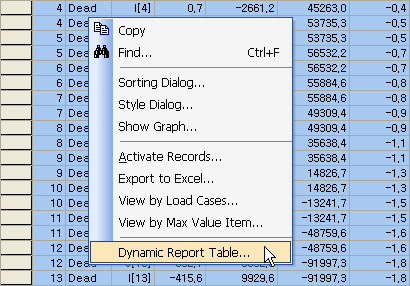
Method 2. Right-click the desired data from the Report Tree and then select "Insert to Report" function from the context menu.
Insert data using Drag & Drop
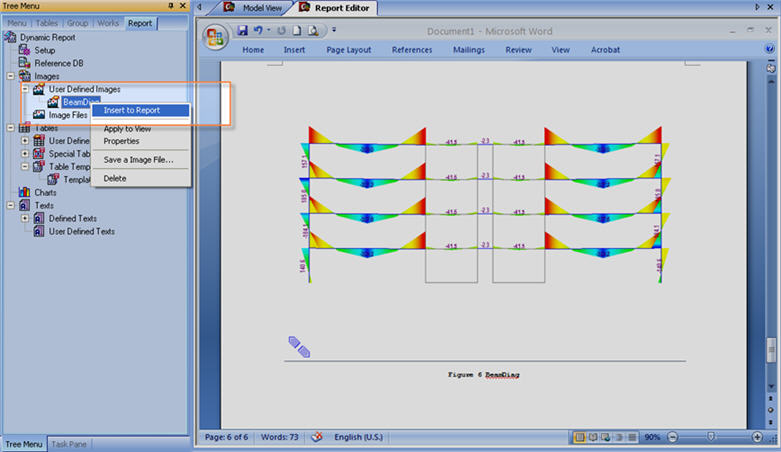
Insert data from the context menu
Applicable data type which can be entered in the report
The following data format can be inserted
in the report: ![]() Images,
Images,
![]() Tables,
Tables, ![]() Charts, and
Charts, and ![]() Tex.
Tex.
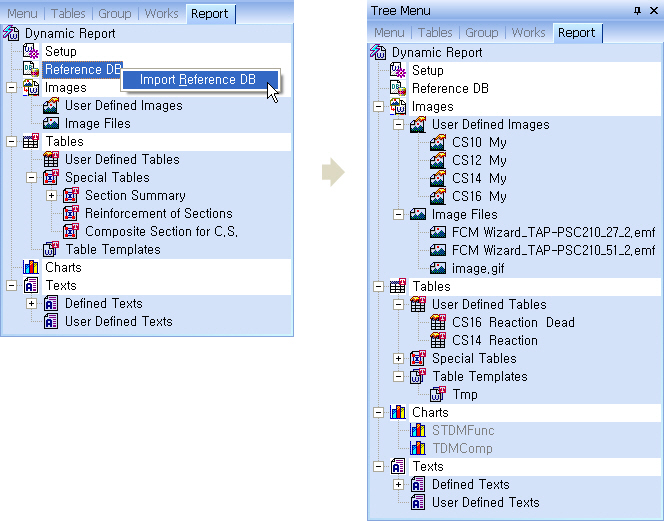
When inserting data into the report, the user needs to manually register the desired data into the Report Tree. However, for the user's convenience, midas Gen provides general data such as section properties, boundary conditions, etc. in Tables > Special Tables and Texts > Defined Texts from the Report Tree. Therefore the user does not need to register the following data separately:
Tables > Special Tables
Section Summary
Reinforcement of Sections
Composite Section for C.S.
Texts > Defined Texts
Control Data
Static Load Case
Story
Node
Boundary
Floor Diaphragm / Rigid Link
Beam / Truss / Wall
Weight / Volume / Surface area of all member
Wind Load / Seismic Load
Load Combination
Self Weight
Nodal Load
Finishing Material Load
System Temperature / Nodal Temperature / Element Temperature / Beam Section Temperature
pushover Global Control / Pushover Load Case
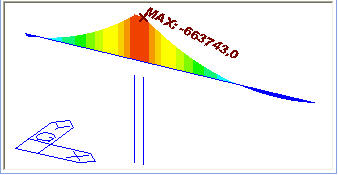
User Defined Images : Insert images registered from the Model View of midas Gen.
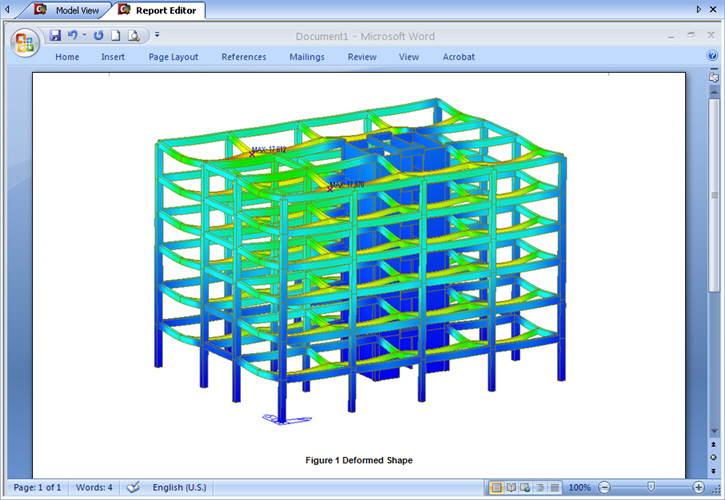
Insert deformed shape image
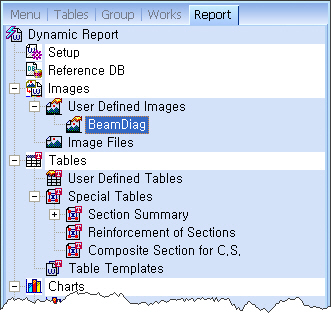
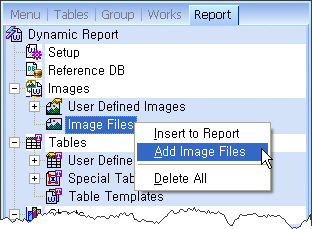
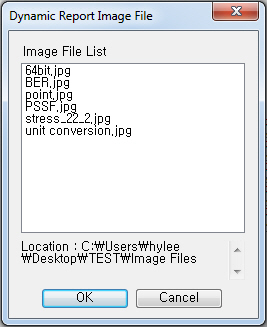
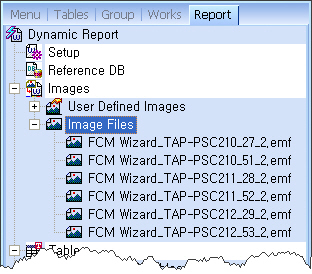
Image Files : Insert images using the image files by registering them in Images > Image Files from the Report Tree.
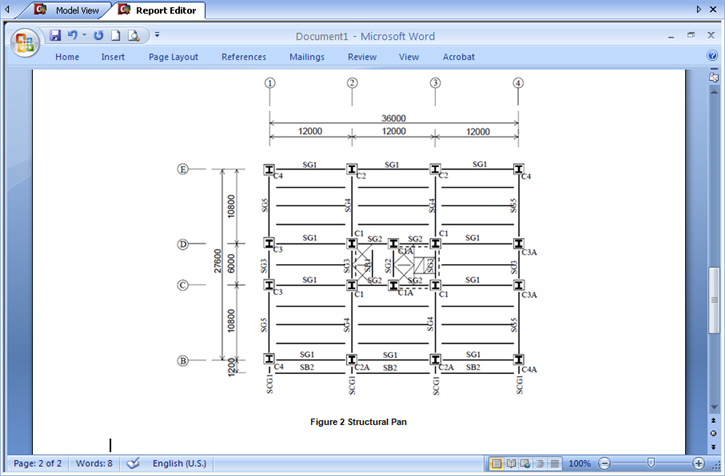
Insert structural plan Image using the image file.
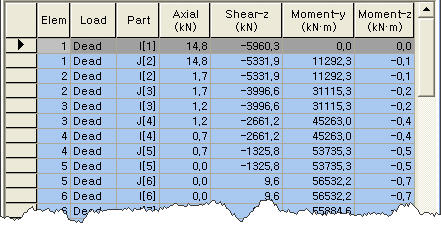
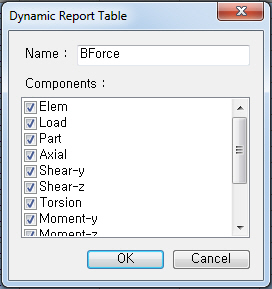
User Defined Tables : Insert tables registered from the spreadsheet table of midas Gen such as model input data, loads, analysis result tables, etc.
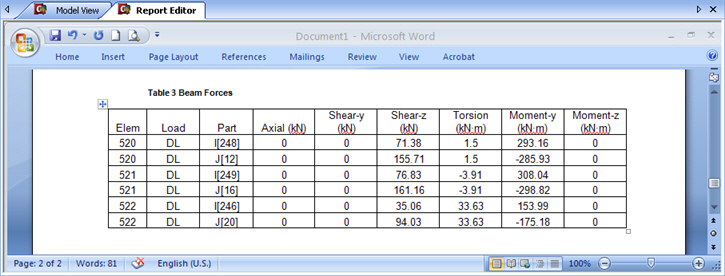
Beam force table results
Special Tables (Summary Tables) : Insert section related data into the table.
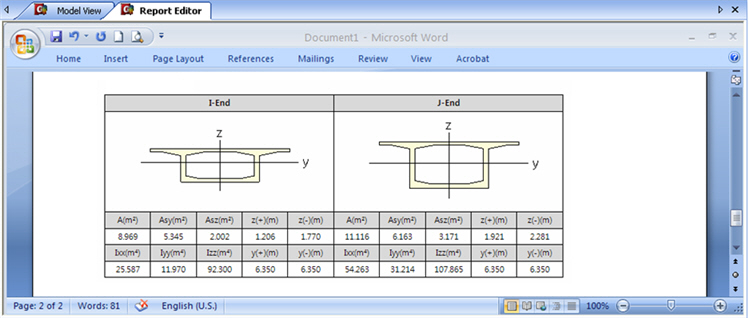
Section summary table results
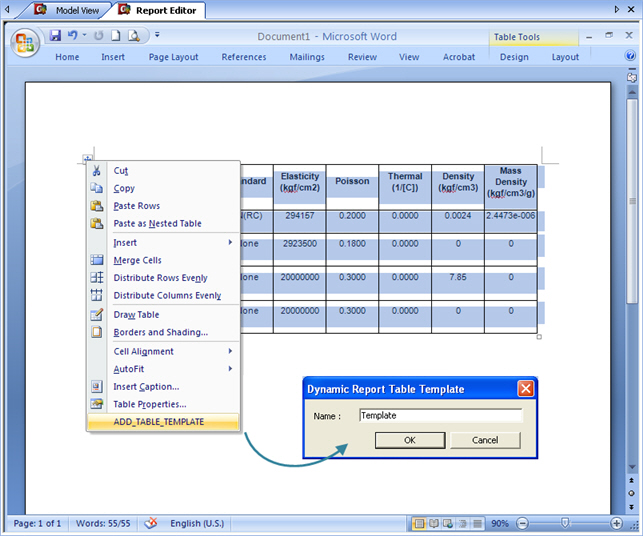
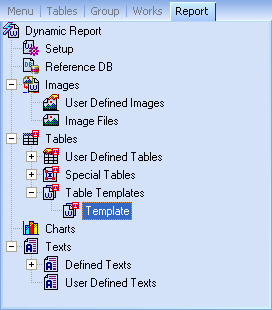
Table Templates : The user can add any table as a table template. This feature will be useful when inserting frequently used tables such as summary of design specification or material properties by registering them as table templates.
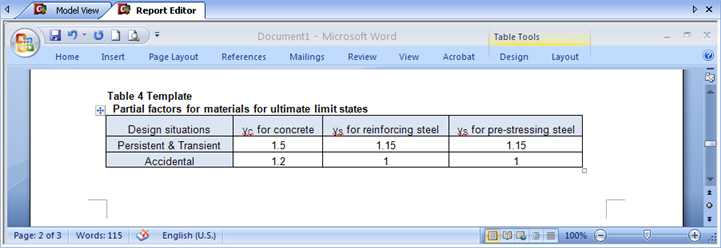
Table Template
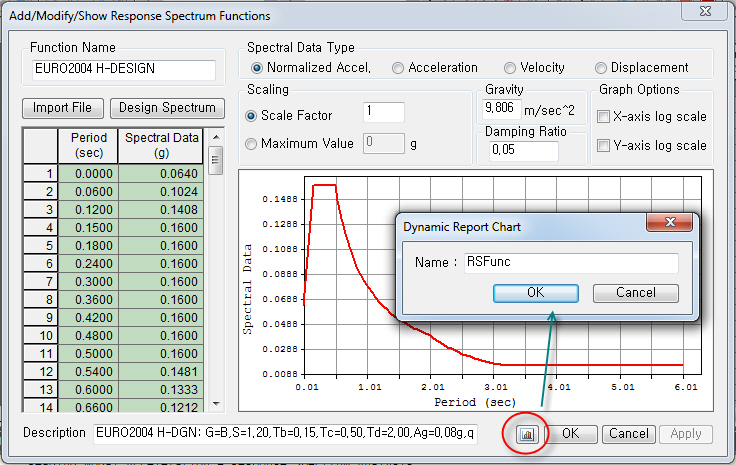
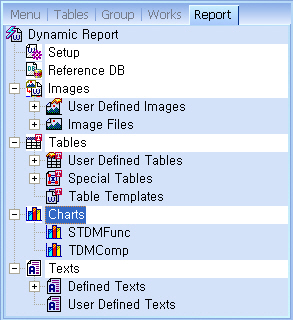
Charts : Insert graphs registered from the model input and output data.
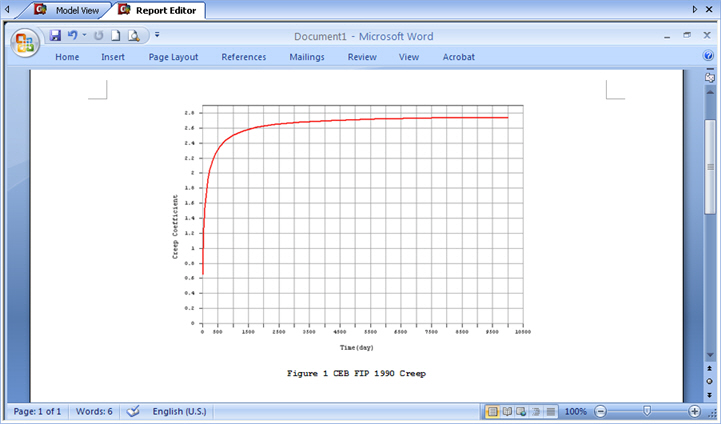
Creep coefficient graph
Defined Texts : Insert general model data such as node, boundary, element, etc.
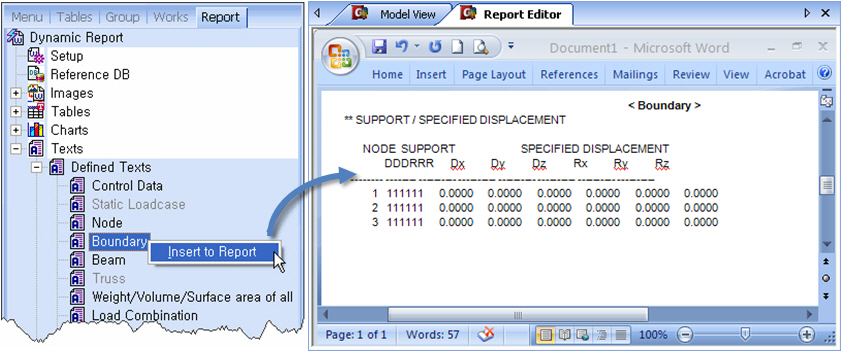
Boundary text in the defined text
User Defined Text : Insert text registered from the model input and output data. This function is available in the Design Result Dialog box.
![]() Modify model data and re-generate
a report
Modify model data and re-generate
a report
If there are any changes in the model file, we can automatically update the pre-generated report. If the user manually entered additional text or images into the report, those data will remain without any changes.
(1) Select Tools > Dynamic
Report Auto Regeneration menu from the Main Menu, or click
![]() icon to open the Auto Regeneration
List dialog box.
icon to open the Auto Regeneration
List dialog box.
(2) All the entered data will be displayed in each tab by data formats. Select the desired data to be updated.
(3) Click ![]() button.
button.
Define Font (
 Setup)
Double-click ![]() Setup
icon from the Report Tree, or right-click on Setup and select
Property menu to define
font.
Setup
icon from the Report Tree, or right-click on Setup and select
Property menu to define
font.
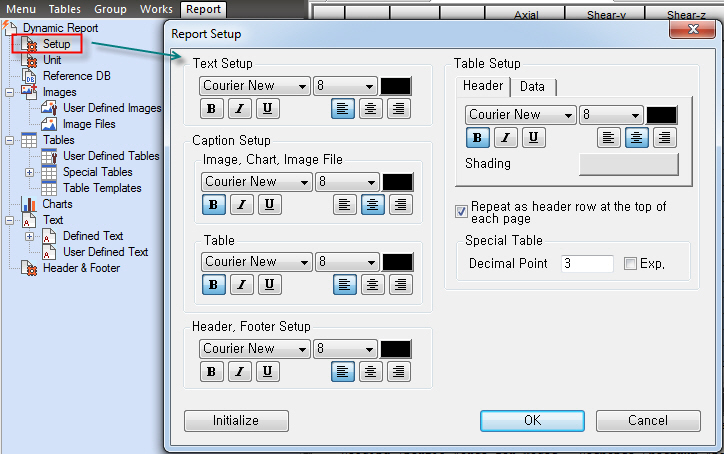
Text
Setup : Define font format for ![]() Texts.
Texts.
Caption
Setup : Define font for ![]() Images,
Images, ![]() Charts,
and
Charts,
and ![]() Tables. Caption
of
Tables. Caption
of ![]() Images and
Images and
![]() Charts will be shown at the
bottom and the caption of
Charts will be shown at the
bottom and the caption of ![]() Tables
will be shown at the top.
Tables
will be shown at the top.
Table Setup : Select the font of table contents in the Data tab. Select the font of table header in the Header tab.
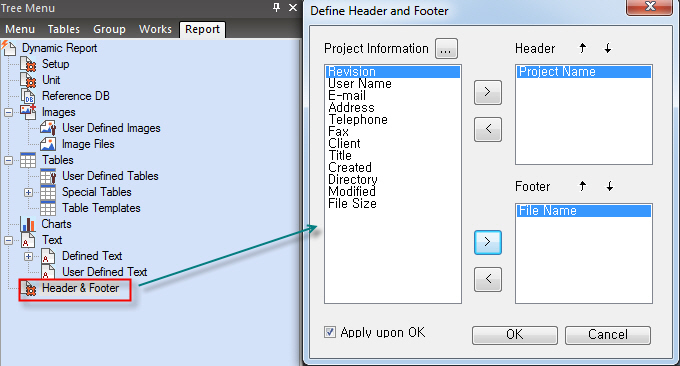
Header, Footer Setup : Define font format for header and footer of the report.
Define Unit (
Unit)
Double-click ![]() Unit
icon from the Report Tree, or right-click on Setup and
select Property menu to
define unit by tables/charts.
Unit
icon from the Report Tree, or right-click on Setup and
select Property menu to
define unit by tables/charts.
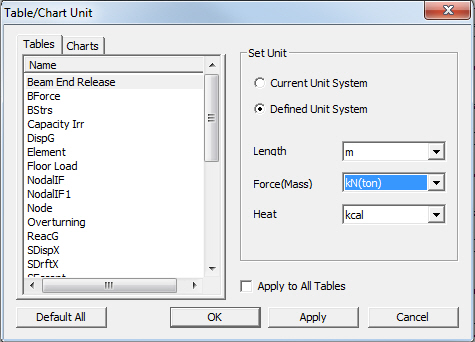
Current Unit System: Select to apply the same unit system currently used in the model file.
Define Unit System: Select to apply a unit system for the selected table/chart.
Apply to All Tables: Apply the current setting to all tables/charts.