Time History Smart Graph
Display graph results for Time history analysis easily.
From the Main Menu select Results > Time History > Time History Graph/Text > Time History Smart Graph.
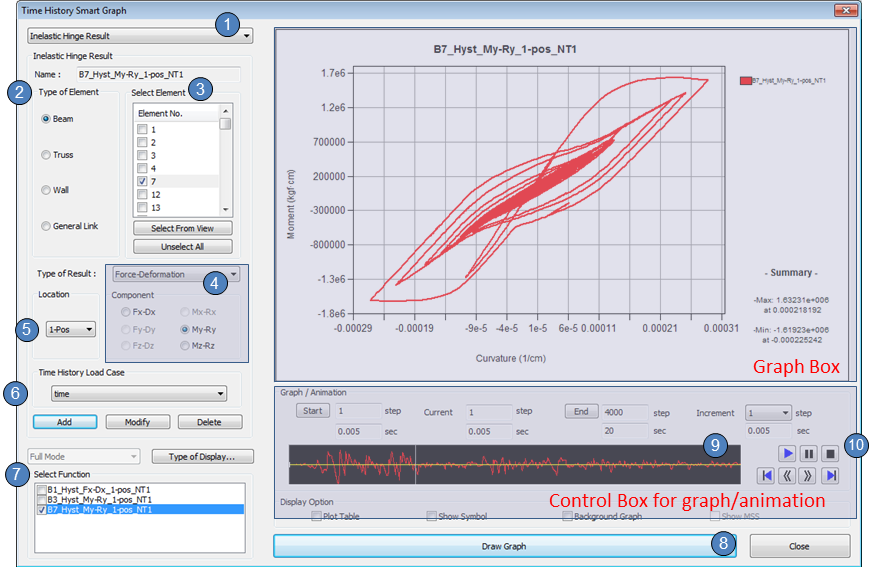
① Select Result Type.
② Select Element Type
③ Select Element No.
“Select from View” : Select elements directly from the model window.
④ Select Result Type
- Provide “Force-Deformation” type, “Force-time” type, and “Deformation-time” type
⑤ Select Position of hinge,
Positions are defined from “Define Inelastic Hinge Properties > Add/Modify Inelastic Hinge Properties > No. of sections column in Component properties ” dialog box.
⑥ Select a time history load case from the list and click “Add” button
⑦ Add graph functions by ⑥ and check on Function which want to see in graph box
⑧ If click “Draw Graph” button, Historic curve for the selected function is displayed.
⑨ If click a specific time in time forcing function, the graph up to the specific time is displayed.
⑩ Curve of animation type can be displayed with “play” button.
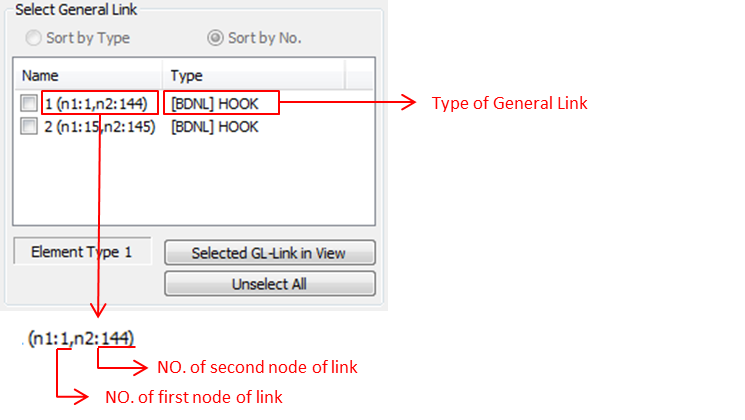
Note. In case of General Link Graph and Seismic Control Device.
Note. Animation
Step: Specify the step at which the time history analysis results need to be displayed. If a specific step is entered,
it moves to the step directly.
Increment: Graphic output is produced and recorded at the specified increment.
Time: The actual time of the loading corresponding to the current step is produced.
![]() :
It auto-generates the animated results of time history analysis.
:
It auto-generates the animated results of time history analysis.
The interval of display is at the specified Increment.
![]() :
Pause Animation generation.
:
Pause Animation generation.
![]() :
Stop Animation generation.
:
Stop Animation generation.
![]() :
Moves to the first step of the time history analysis result.
:
Moves to the first step of the time history analysis result.
![]() :
Move backward to the previous steps by the increment.
:
Move backward to the previous steps by the increment.
![]() :
Move forward to the subsequent steps by the increment.
:
Move forward to the subsequent steps by the increment.
![]() :
Move to the last step of the time history analysis results.
:
Move to the last step of the time history analysis results.