Output Method
Select the types of
the graphs to be produced in output. Check on two
selectable graphs to simultaneously produce the output.
Contour
Produce contours.
Vector
Produce vectors.
Water
Level
See the water
level.
Virtual
Sliding Surface
Produce the results
of virtual sliding surfaces (This is activated only after completing the
analysis of the Slope Modules-LEM and SAM).
Contour
Discontinuous
Contour
In order to clearly
distinguish the contour, banding will be displayed.
Gradient
Contour is smoothly
expressed.
Edge
Specify the method of
expressing the mesh in graphical displays of analysis results like contour
graphs.
No
Edge
Mesh will not be displayed.
Mesh
Edge
Display the elements’
edges.
Feature
Edge
Display the feature
edges of mesh.
Status Change
Legend
Display the legend.
Result
Value
Produce the result values.
Display
Mode
Original
Check the original results.
Iso
Line
Check the contour results.
Mirror
Mode
Check the symmetrical
results.
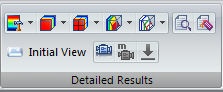
Initial
View
The parameters used
are initialized for Post-processing the result graphics.
Extract Results
Extract desired data
from the analysis results.
Result
Data
Analysis
Case
Select the analysis
case out of which results will be extracted.
Result
List
Specify the item of
desired results.
Step:Result
Specify the steps requiring
the result values.
Extract
Element / Node Results
User
Defined
Select the elements/nodes
at which the result values will be extracted. ID numbers may be directly
specified.
Sort
The results are extracted
for the selected elements/nodes by sorting the ID numbers in reference
to the X/Z directions.
Maximum
Value
Extract the maximum
value.
Minimum
Value
Extract the minimum
value.
Absolute
Maximum
Extract the absolute
maximum value.
Element
Extraction Location
In case of results extracted
from 1D elements, identify the extracted locations.
Table
Results extracted into
tables.
Graph
Results extracted into
graphs.
Close
Close the dialog box.
Result Value Tag
Tag nodes or elements
specified by the user and show the result values.
Type
Node
Create tags showing
the result values of the nodes.
Element
Create tags showing
the result values of the elements.
Color
Tag
Color
Specify the color of
the tag.
Text
Color
Specify the color of
the result values shown in the tags.
Results
When selecting nodes
or elements, Type, ID and the X,Z coordinates of
the selected positions are automatically entered and the result values
are displayed in the Value column. The user can add texts to the Value.
Clear
All
Delete all tags.
Maximum
Show the maximum value
and the corresponding node/element information.
Minimum
Show the minimum value
and the corresponding node/element information.
Absolute
Show the absolute maximum
value and the corresponding node/element information.
| 


