Stress (Beam/Truss)
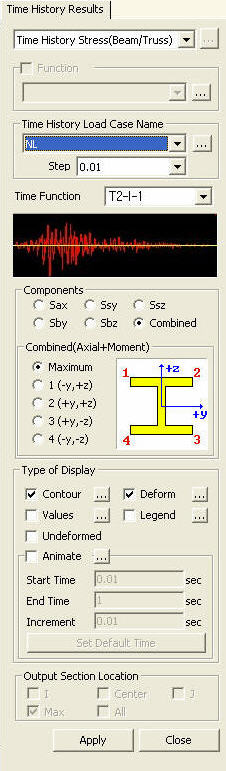
Check member stresses of Beam and Truss elements resulting from time history analysis in Contours.
From the Main Menu select Results > Time History Results > Stress (Beam/Truss)
Select Results > Stress (Beam/Truss) in the Menu tab of the Tree Menu.
|
|
|
 Type of Display
Define the type of display as follows:
|
Contour |
Display the stresses of beam elements in contour. |
|
|
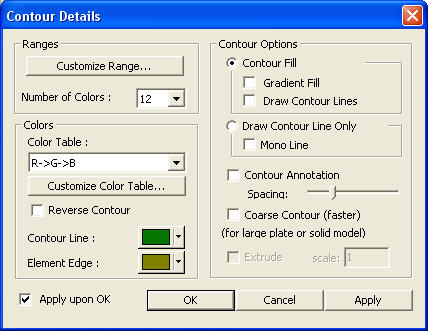
Ranges: Define the contour ranges.
Note If the Contour Range values exceed the output values, they are entered at Rank 0 and Rank 11.
Number of Colors: Assign the number of colors to be included in the contour (select among 6, 12, 18, 24 colors) |
|
Colors: Assign or control the colors of the contour.
Color Table: Assign the type of Colors.
Reverse Contour: Check on to reverse the sequence of color variation in the contour.
Contour Line: Assign the boundary line color of the contour
Element Edge: Assign the color of element edges while displaying the contour
Contour Options: Specify options for contour representation
Contour Fill
Gradient Fill: Display color gradient (shading) in the contour.
Draw Contour Lines: Display color boundaries in the contour.
Draw Contour Line Only
Mono line: Display the boundaries of the contour in a mono color.
Contour Annotation
Spacing: Specify the spacing of the legend or annotation.
Coarse Contour (faster) (for large plate or solid model)
Extrude The option is not concurrently applicable with the Deformed Shape option. Similarly, the option cannot be concurrently applied to the cases where the Hidden option is used to display plate element thicknesses or the Both option is used to represent Top & Bottom member forces (stresses). |
|
|
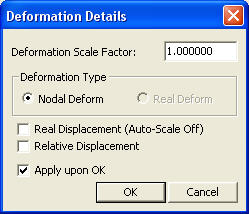
Deform |
Display the deformed shape of the model. |
|
|
Deformation Scale Factor Deformation Type
Nodal Deform: Display the deformed shape only with nodal displacements.
Real Displacement (Auto-Scale off): The true deformation of the structure is graphically represented without magnifying or reducing it. This option is typically used for geometric nonlinear analysis reflecting large displacement. Relative Displacement: The deformation of the structure is graphically
represented relative to the minimum nodal displacement, which is set to 0. |
|
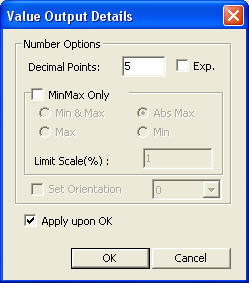
Values |
Display the displacements of solid elements resulting from Heat of Hydration analysis in numerical values. |
|
|
Decimal Points: Assign decimal points for the displayed numbers. Min & Max: Display the maximum and minimum values. Set Orientation: Display orientation of numerical values.
Note |
|
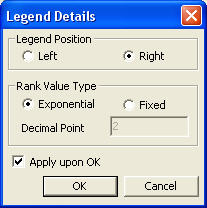
Legend |
Display various references related to analysis results to the right or left of the working window. |
|
|
Legend Position: Position of the legend in the display window Rank Value Type: Specify a type of values in the Legend and the number of decimal points. |
|
Undeformed |
Overlap the undeformed and deformed shapes of the model. |
|
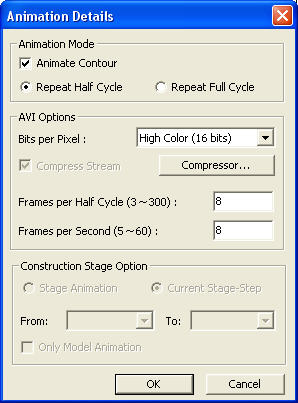
Animate |
Dynamically simulate the transition process.
Click |
|
|
Animation Mode: Check on to animate the analysis results.
Note
Animate Contour: Option to change the color of the contour representing the transition according to the magnitudes of variation
Note AVI Options: Enter the options required to produce the animation window.
Bits per Pixel: Number of bits per pixel to create the default window for animation Construction Stage Option: Select the animation options when the construction stage analysis is performed.
Stage Animation: Animations by construction stages |
Start Time: Start time of animation of analysis results
End Time: Finish time of animation of analysis results
Increment: Time increment for analysis results to be animated
![]() : Set the time to be used for animation as the initial state.
: Set the time to be used for animation as the initial state.
Output Section Location
Assign the section locations at which member forces of the beam elements are produced in numerical values.
I: Display the member force at the start node (N1) of a beam element.
Center: Display the member force at the center of a beam element.
J: Display the member force at the end node (N2) of a beam element.
Abs Max: Maximum absolute values of member forces among the 5 points of (4-sectioned) beam elements are displayed at
the centers of the beam elements.
Min/Max: Minimum and maximum member forces are numerically displayed at the corresponding locations among the 5
points of (4-sectioned) beam elements.
All: The member forces at the i-end, center and j-end are numerically displayed.