Story Shear/Drift/Drift Ratio
Plot graphs for story vs. story shear, story vs. inter-story drift or story vs. inter-story drift ratio for each story to represent the pushover analysis results.
Note
In order to use this function, the Story Shear Force Ratio of Member should be checked on in Model > Building > Control Data of the Main Menu.
From the Main Menu select Design > Pushover Analysis > Pushover Story Graph > Story Shear/Drift/Drift Ratio.
This graph can be plotted to check the story vs. story shear curve, the story vs. inter-story drift curve or the story vs. inter-story drift ratio curve for each Pushover Step when the pushover analysis is completed.
|
|
|
|
|
By invoking the Context Menu, various graphic expressions, data saving and image saving are possible.
Change Title & Label The title and subtitles to the x & y-axes may be changed.
Draw Item Name At Graph Lines Display the description on the graph lines.
Draw Gray & Color Graph Draw the graph in gray or color. (default=Color Graph)
Save Graph As Image Save the graph in the graphic file format of BMP, JPG or EMF. (default=BMP image)
Save Graph As Text Save the graph in the format of a text file.
Save Graph As Excel Export the graph data in the format of Excel Sheet. |
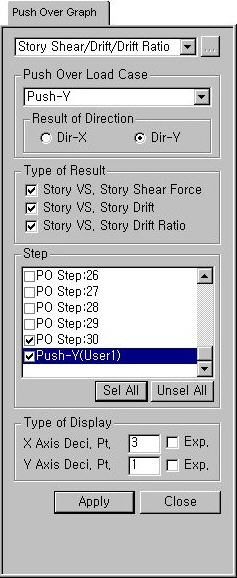
 Pushover Load Case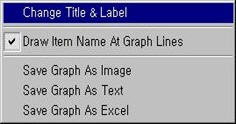
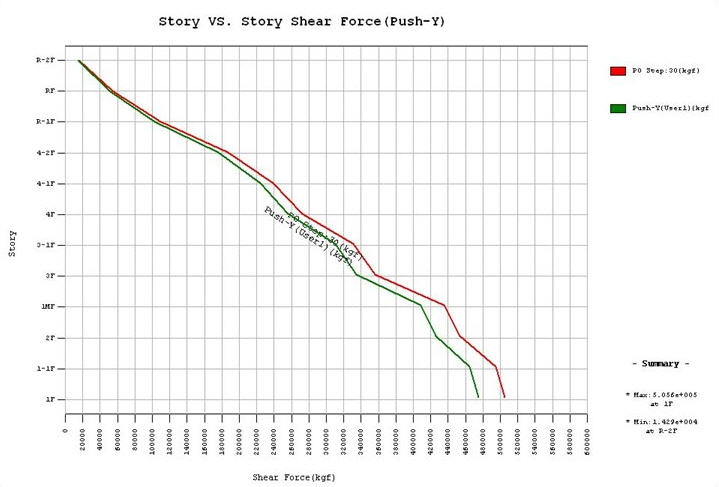
Story Shear/Drift/Drift Ratio Graph (Story VS Story Shear)
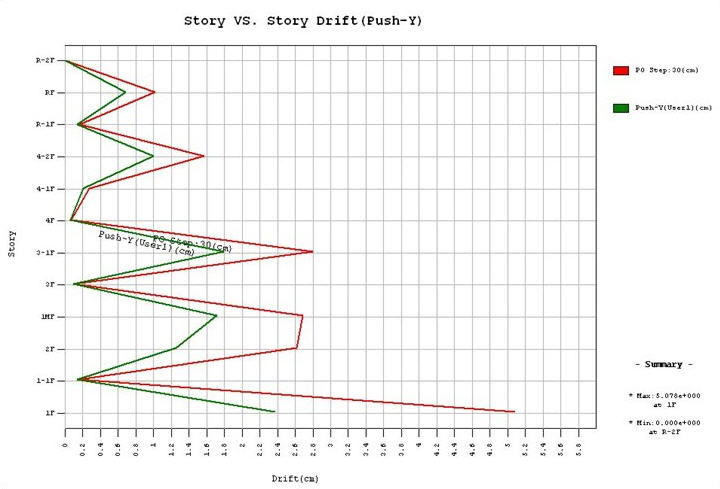
Story Shear/Drift/Drift Ratio Graph (Story VS Story Drift)

Story Shear/Drift/Drift Ratio Graph (Story VS Story Drift Ratio)