P-M Curve

Check P-M interaction curve of selected member. Tag result values in model view.


ΆΖ Detail Description

Activate P-M Curve function and select member.

Selectable member : RC Column, RC Sub Column, RC Brace, RC plate (Axial + Flexure)
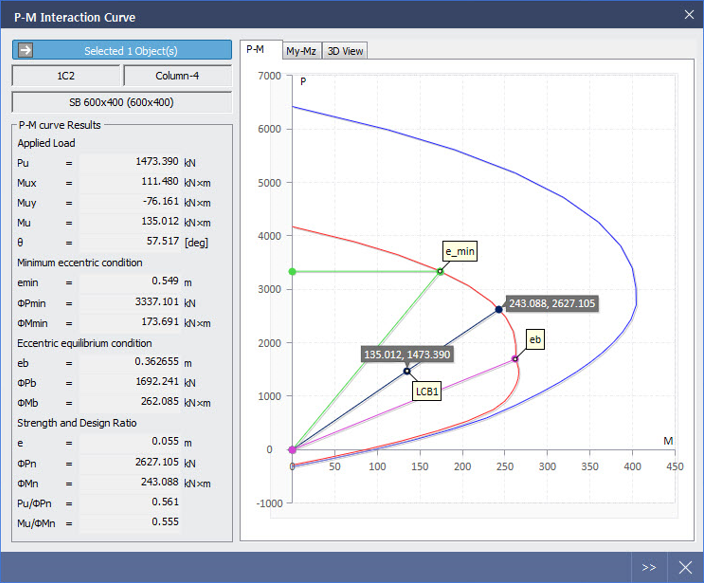
Simple Mode

19._P-M_Curve.png

Load on member, strength and P-M relation curve can be checked in Simple Mode.
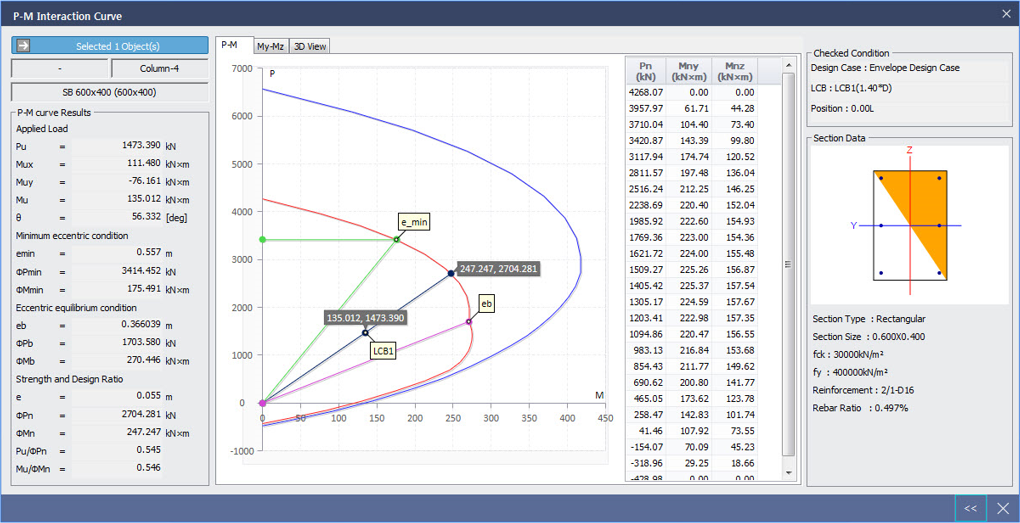
Blue_Square.gifP-M Curve Result : Analysis result of P-M relation curve

Black_Square.gifApplied Load : Applied load on member

Black_Square.gifMinimum eccentric Condition : Member strength at minimum eccentric condition

NOTE.png Expressed as 'e_min' from the graph.


Black_Square.gifEccentric equilibrium condition : Member strength at eccentric equilibrium condition.


NOTE.png Expressed as 'eb' from the graph.


Black_Square.gifStrength and Design Ratio : Design strength and ratio at eccentricity.

  NOTE.png Expressed with name of design load from the graph.


Detail Mode

19._P-M_Curve2.png

Click 19._P-M_Curve3.png to access Detail Mode dialog from Simple Mode. Click 19._P-M_Curve4.png to go back to Simple Mode from Detail Mode.

Strength, checked condition and section information used to create P-M relation curve can be reviewed in Detail Mode.

Blue_Square.gifChecked Condition

Black_Square.gifDesign Case : Design Case used for member design

Black_Square.gifLCB : Load combination for member design

Black_Square.gifPosition : Position of member force which is used for member design


Blue_Square.gifSection Data

Black_Square.gifSection Type

Black_Square.gifSection Size

Black_Square.giffck

Black_Square.giffy

Black_Square.gifReinforcement

Black_Square.gifRebar Ratio

Top_Button.gif