Plot Diagram
Plot User Defined Diagrams.
Generate a diagram by selecting the Groups defined in Define Diagram.
From the Main Menu select Results > Results > Diagram > Plot Diagram.
 Load Cases/Combinations
Select a desired load case or load combination.
Click ![]() to
the right to enter new or modify existing load combinations. (Refer
to "Load Cases
/ Combinations")
to
the right to enter new or modify existing load combinations. (Refer
to "Load Cases
/ Combinations")
Step
Specify the step for which the analysis results are to be produced. The Step is defined in geometric nonlinear analysis as Load Step, and additional steps are defined in the construction stages of bridges or heat of hydration analyses.
Diagram
Group
Group Names defined in Define Diagram are listed in the Diagram Group box. Check on the Groups for which the Diagram is to be generated.
Scale
Factor
Auto: The maximum output value to be displayed in a diagram is equal to 1/20 of the diagonal length of the virtual hexahedron containing the entire model.
Ref.Value: The entered value is equal to 1/20 of the diagonal length of the virtual hexahedron containing the entire model.
In the example shown below, a diagram is generated such that the maximum output value is equal to 1/20 of the diagonal length (the blue solid line) of the virtual hexahedron (the black dotted line) containing the whole model. Since a diagram is drawn based on the maximum output value of all the Groups and not of each Group, in cases when different types of results (forces and displacements, or forces and stresses) are plotted simultaneously, a specific type of result can be relatively small as compared to the overall scale. In this case, the user should control the Scale Factor using the Display Option for each Group.
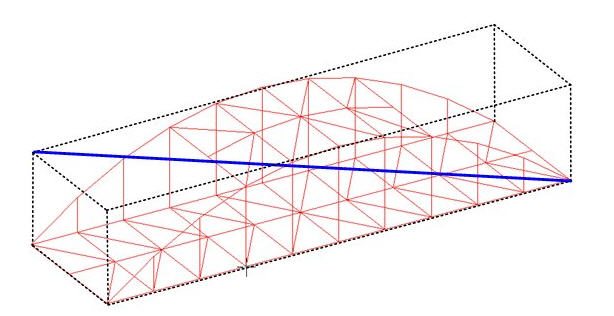
Virtual hexahedron and its diagonal
The diagrams shown below display the axial forces at arch ribs and bending moments at girders.
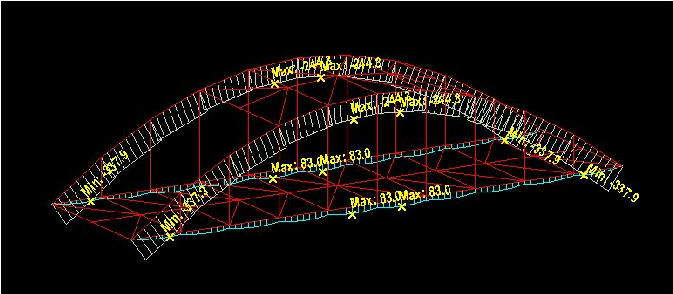
Diagram applying Auto Scale
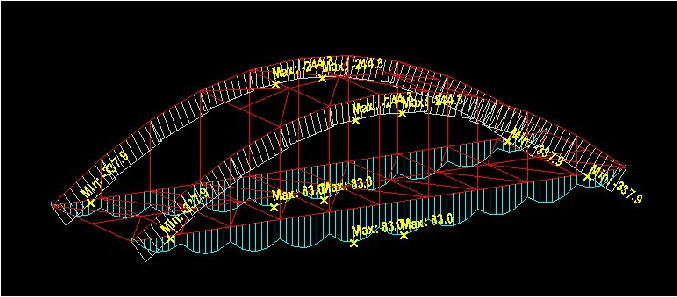
Diagram modifying the Scale Factor for the girders
Select a Group from the Diagram Group
list and click ![]() to control the display settings of the result views for
the corresponding Group.
to control the display settings of the result views for
the corresponding Group.
Diagram
Options
Color : Assign a color for the Diagram.
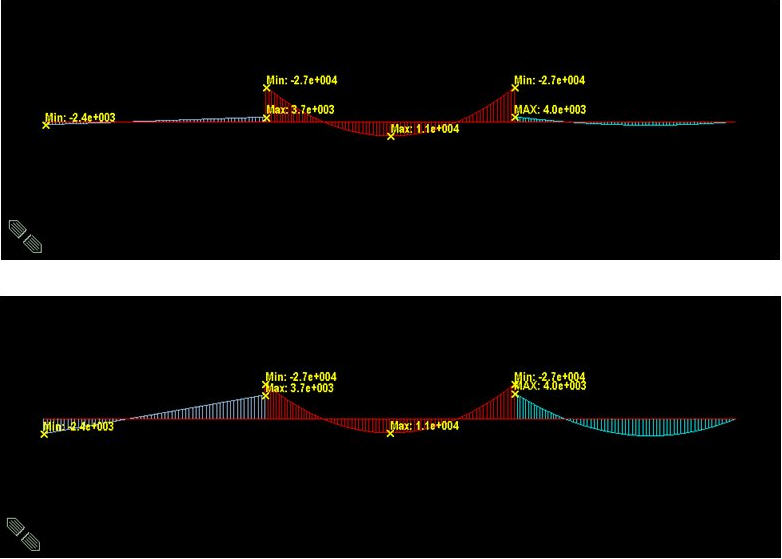
Scale : Specify a Scale Factor for the Diagram. Since the various types of results are displayed simultaneously, the default Scale Factors may sometimes be inappropriate. In such cases, the user should enter the appropriate Scale Factors for each Diagram Group.
The following figure shows an example of inappropriate Scale Factors. The next figure shows an example where appropriate Scale Factors are used.
Display
Values
Check the options for displaying the values on the screen.
Decimal Points: Assign decimal points for the displayed numbers.
Exp.: Express as exponential.
Set Orientation: Display orientation of numerical values.
Note
The default Decimal Points can be controlled in "Preferences".
Set Orientation = 0 horizontally displays the numerical values to the right of nodes or elements.
The orientation angle represents the counter-clockwise direction, which may be used to enhance the readability of the numbers.
Output Section Location: Assign the section locations at which bending moments of the beam elements are produced in numerical values.
I: Display the bending moment at the start node (N1) of a beam element.
Center: Display the bending moment at the center of a beam element.
J: Display the bending moment at the end node (N2) of a beam element.
Abs Max: Maximum absolute values of bending moments among the 5 points of (4-sectioned) beam elements are displayed at
the centers of the beam elements.
Min/Max: Minimum and maximum bending moments are numerically displayed at the corresponding locations among the 5 points of (4-sectioned) beam elements.
All: The bending moments at the i-end, center and j-end are numerically displayed.
Min/Max Only in Group: Display only the maximum/minimum value in each Group.
Min & Max: Display the maximum and minimum values.
Abs Max: Display the absolute maximum value.
Max: Display only the maximum value.
Min: Display only the minimum value.
Limit Scale(%): Display all the bending moments of the beam elements, which are in the range of (Max-Min)*Limit Scale relative to the selected maximum or minimum