Post: Contour
![]()
Function
Specify detail options for displaying contour plot.
Call
Property Window > Contour
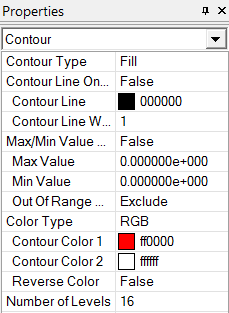
<Contour Menu in Property Window>
Contour Type
Fill
Display
result with filled contour.
Line
Display result with line contour.
Element Edge
Specify
the color of element edge.
Element Edge Thk.
Specify
the thickness of element edge.
Contour Line On/Off
Determine
whether or not to display contour lines.
Contour Line
Specify
the color of contour lines.
Contour Line Thk.
Specify
the thickness of contour lines.
Max/Min Value On/Off
Determine
whether or not to input Min/Max value of contour.
Max Value
Enter
the max. value.
Min Value
Enter
the min. value.
Out of Range Part
Exclude
Do not
display parts where the result value exceed min/max value.
Fill
Fill
the parts with the maximum and minimum colors accordingly.
Color Type
RGB
Display
contour with RGB colors.
Gray Scale
Display
contour in gray scale.
Gradient Mono Color
Display
contour in gradient from white to a color which is selected in "Contour
Color 1."
Repeat Two Colors
Display
contour with two repeating colors which are selected in "Contour
Color 1" and "Contour Color 2."
User Define
Display
contour with user-defined colors.
Contour Color 1
Selected
a color to be used in Gradient Mono Color or Repeat Two Colors.
Contour Color 2
Select
a color to be used in Repeat Two Colors.
Reverse Color
Reverse
the order of contour colors.
Band Number
Specify
the number of colors shown in contour.
No Result Entity
Min
Display
no result mesh with minimum contour value.
Max
Display
no result mesh with maximum contour value.
Zero
Display
no result mesh with 0 contour value.
Exclude
Do not
display no result mesh.
Wireframe
Display
null result mesh with "Wireframe" displaying method.
Feature Edge
Display
no result mesh with Feature Edge displaying method.
Coarse Contour
Display contour coarsely. It has faster displaying speed, but it may not have fine contour figure.
Number Of Level