Post Command
![]()
Function
The Post Command toolbar in midas GTS controls display methods of result plot.

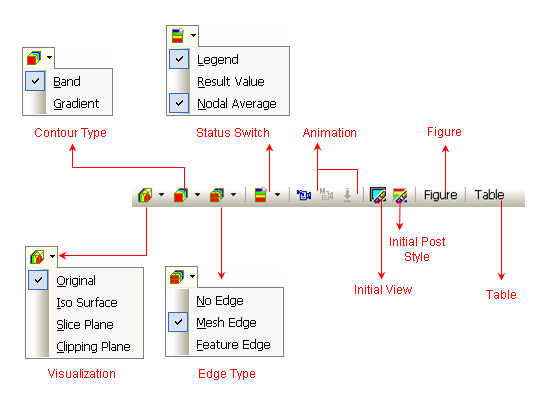
<Post Style Toolbar>
The Post Data toolbar includes the following menus and icons..
Visualization
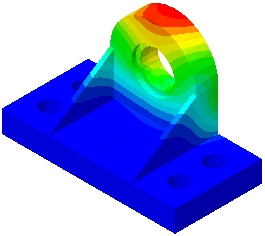
It provides various methods of displaying Contour Plot.
Original
It
displays a general contour plot.
Iso-Surface
Iso-surface
Plot displays surfaces, which represent the results of equal magnitudes.
Detail options such as defining Iso-Surface values can be specified in
Iso-Surface in the Property
Window.
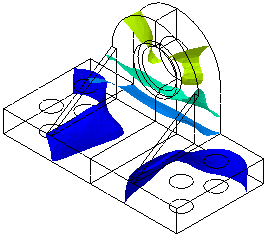
Slice Plane
Slice
Plane displays results at sections specified by the user.
Detail options such as location of cutting planes can be specified in Slice Plane in the Property
Window.
Clipping Plane
Clipping
Plane displays results of one side from a plane specified by the user.
Detail options such as location of cutting planes can be specified in Clipping Plane in the Property
Window.
Mirror Mode
It
display result contour after it mirrors the contour by a plane specified
by the user.
Detail options such as defining a mirror plane can be specified in Misc in the Property
Window.
|
|
|
|
<Slice Plane Plot> |
|

Contour Type
Band
It shows distinct
band color display in contour.
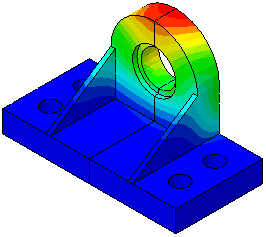
Gradient
It
smooths out edges of band for gradient display.
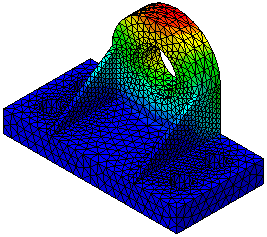
Edge Type
Determine mesh edge line displaying method.
No Edge
Hide
all mesh edges.
Mesh Edge
Show
all mesh edges.
Detail options such as thickness of edge line can be specified in Contour in the Property
Window.
Feature Edge
Show
only feature edges which represent distinctive lines (determined by the
angle between the two connecting free faces.) Refer to Graphic Display
for more information about Feature Edge.
Detail options such as Feature Angle and line thickness can be specified
in Misc. in the Property
Window.
|
|
|
|
Status Switch
Legend
Determine whether
or not to display Legend.
Detail options such as its colors can be specified in Legend in the Property Window.
![]() Most of Legend
controls (color, band range, etc) can be performed by mouse operation
at the Legend.
Most of Legend
controls (color, band range, etc) can be performed by mouse operation
at the Legend.
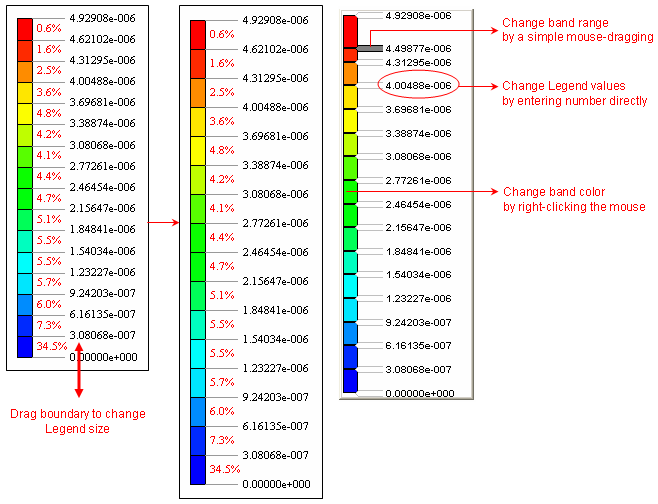
<Legend Control Example>
Result Value
Determine whether
or not to display result value.
Detail options such as its color and size can be specified in Values in the Property Window.
Nodal Average
Determine whether
or not to plot element results such as stress with nodal average value.
Detail options can be specified in Average Node
in the Property Window.
Animation
It creates
animation of current result display.
Animation functions are provided in the Animation Toolbar located at the
bottom of the Work Window.
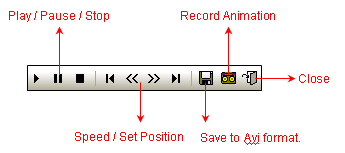
<Animation Toolbar>
Multi Step Animation
Click
 button to create an animation which contains
multi/step results. User can specify steps for the animation in the Multi
Step Animation dialog box which appears by clicking
button to create an animation which contains
multi/step results. User can specify steps for the animation in the Multi
Step Animation dialog box which appears by clicking  button. In addition, it provides Min/Max
value range to be applied in the animation.
button. In addition, it provides Min/Max
value range to be applied in the animation.
Initial View
It removes
the analysis result output and returns back to the analysis model.
Initial Post Style
It initializes
the current post style to the default setting.
Figure
It enables
to save both the current Post Style and result data in the Post-Works
Tree. The saved figure can be recalled at any time when user wants to
view.
Table
It outputs the currently displayed result to a table.