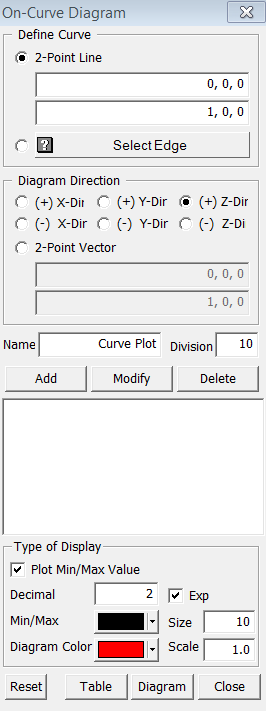
On-Curve Diagram
![]()
Function
Display the analysis results as an arbitrary curve defined by the user.
Call
Result > On-Curve Diagram
<On-Curve Diagram>
Define Curve
2 Point Curve
Specify
a curve by inputting two coordinates. Snap is applicable for entering
the coordinates.
Select Edge
Select
an Edge directly from the geometry model.
Diagram Direction
Define
the direction to display the diagram.
Division
Enter
the number of sampling divisions along the curve.
Name
Enter
the name of the diagram.
Add
Include
the diagram in the list.
Modify
Modify
the specification of the selected diagram.
Delete
Delete
the selected diagram.
Diagram Color
Specify
the color of the diagram lines.
Min/Max Color
Specify
the color of Min/Max value (only for Plot Min/Max Value checked)
Scale
Specify
the scale factor for the diagram.
Size
Specify
the size of text in the diagram.
Table
Output
the result in a table.
Diagram
Output the result to a diagram.