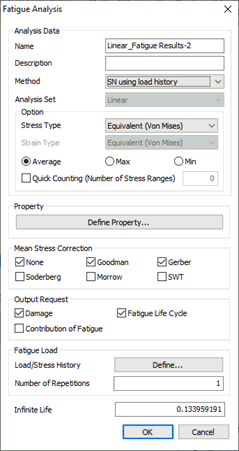 
Fatigue Analysis
Fatigue
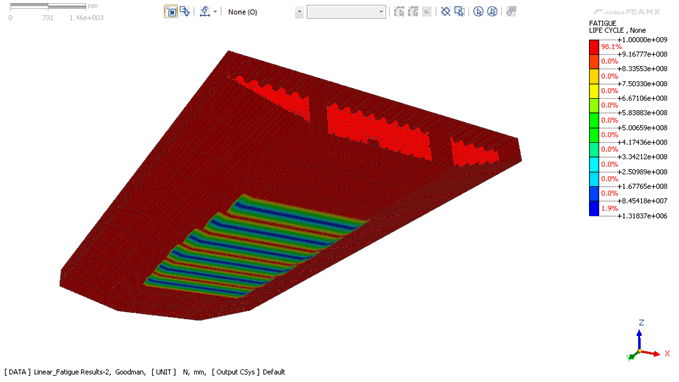
Lifecycle Contour
The
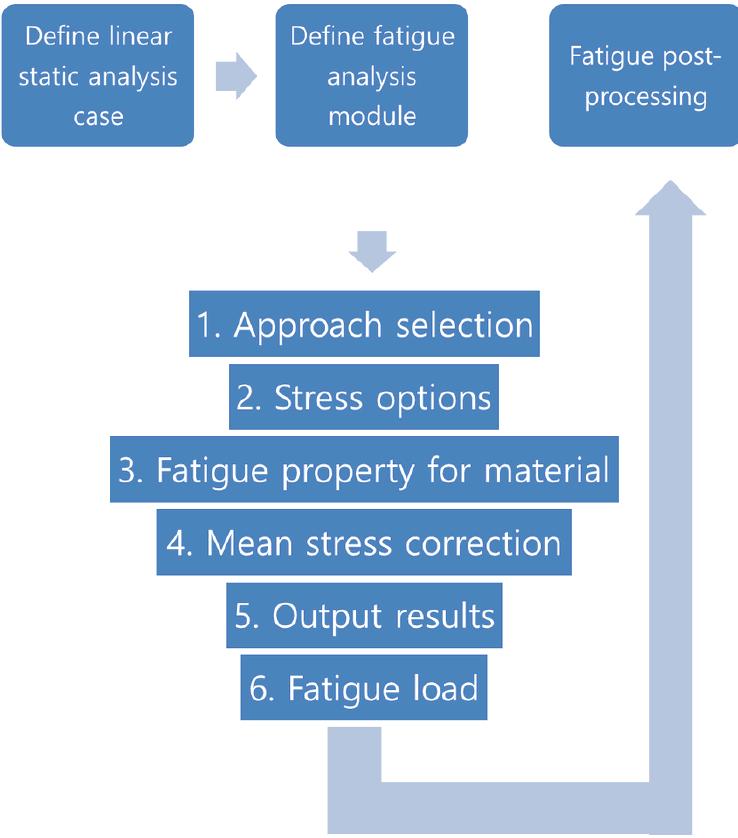
flow chart for fatigue analysis is as shown below:
To start your
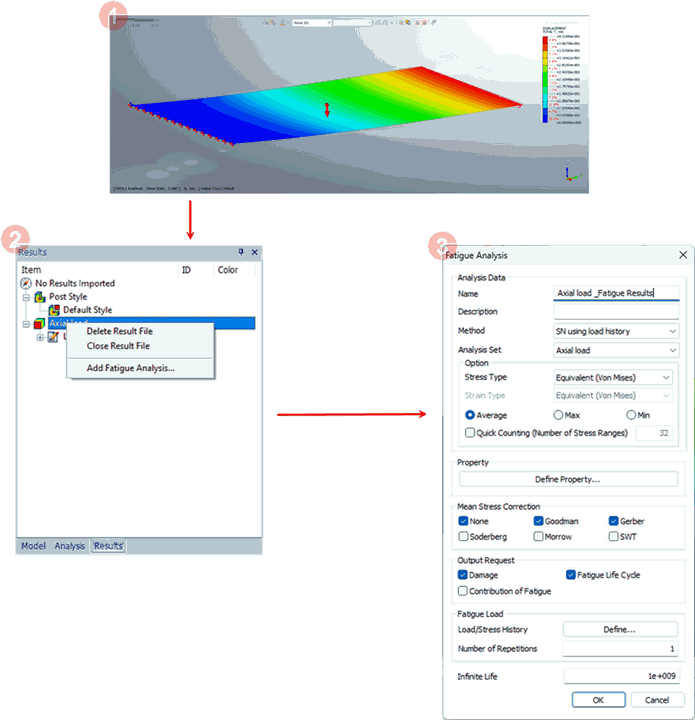
fatigue analysis setup, it is necessary to perform static
analysis for your model. When the static results are loaded,
you can enter the Fatigue Analysis dialog box.
Name
Enter
the name for the analysis case.
Description
Enter
the description for the specific analysis case.
Method
The user can specify the S-N and E-N methods
by using the loading, stress, or strain results based
on the linear static analysis carried on the structure.
Users can specify the following methods:
1.SN using loading history
2.EN using loading history
3.SN using stress history
4.EN using stress history
5.EN using stress/strain history
Analysis
Set
Select the previously conducted
analysis case for implementing the Fatigue Analysis.
Stress
Type
Experimental test data is mostly
uniaxial whereas FE results are usually multiaxial. At
some point, stress must be converted from a multiaxial
stress state to a uniaxial one. Equivalent (Von Mises),
Signed Von Mises, Absolute Maximum Principal, and Maximum
Shear options are available for this purpose.
Property
Assign the specific property
for the selected material types where fatigue load cases
will be generated.
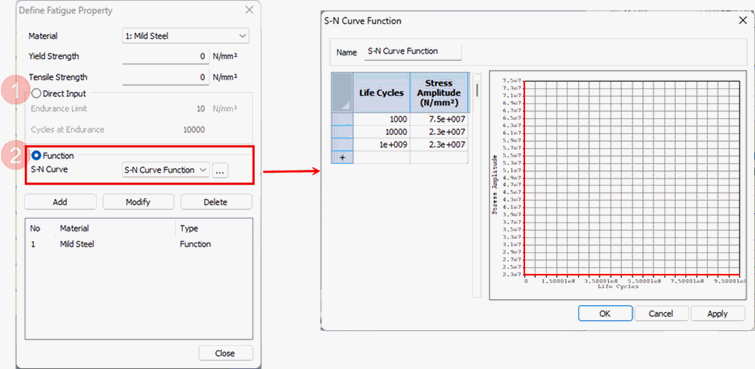
Stress
Life Approach
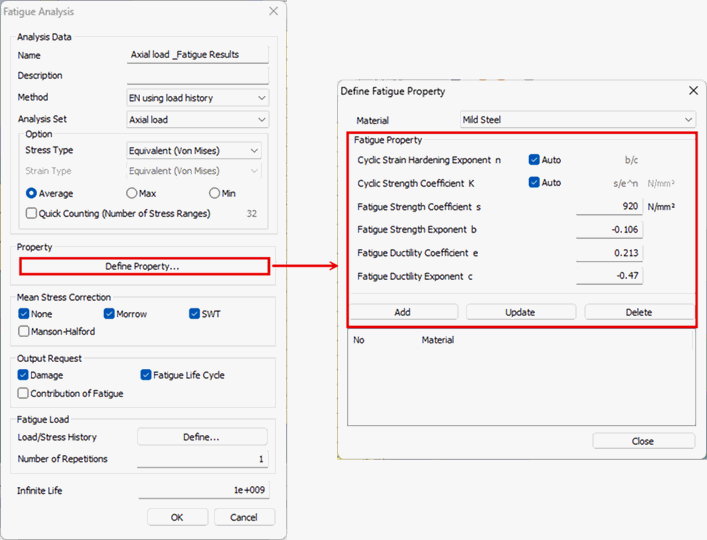
Strain
Life Approach
Mean Stress Correction
For the different
combinations of mean stresses and alternating stresses,
we can use the Goodman,
Gerber, Soderberg, Morrow, or SWT method of fatigue
life prediction in the case of the S-N approach. These
methods can be chosen depending on the material properties
and loading criteria.
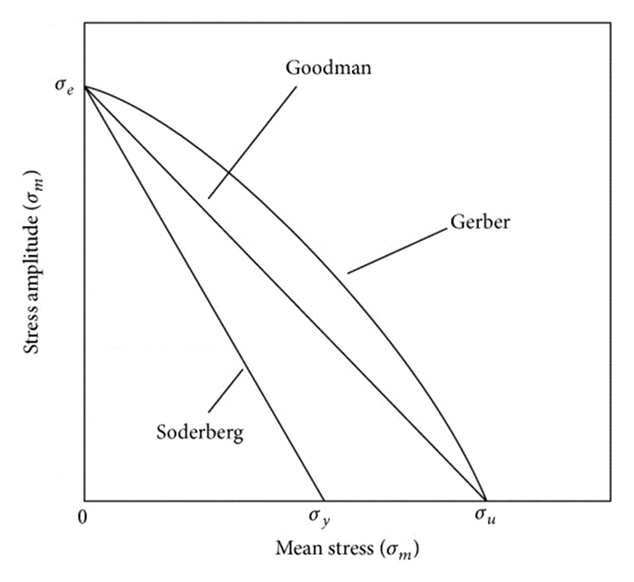
Mean
Stress Correction Approach
If
the stress cycle is fully reversible and alternating with
no deviation then no mean stress correction is required
and, in that case, None can be selected.
By
applying several individual strain amplitudes to the E-N
curve, which has been extracted through rain flow counting,
each number of cycles and the corresponding individual
damage level are obtained. The user can use either Morrow, SWT,
and Manson-Halford
method of fatigue life prediction in the case of the E-N
approach.
Output
Result
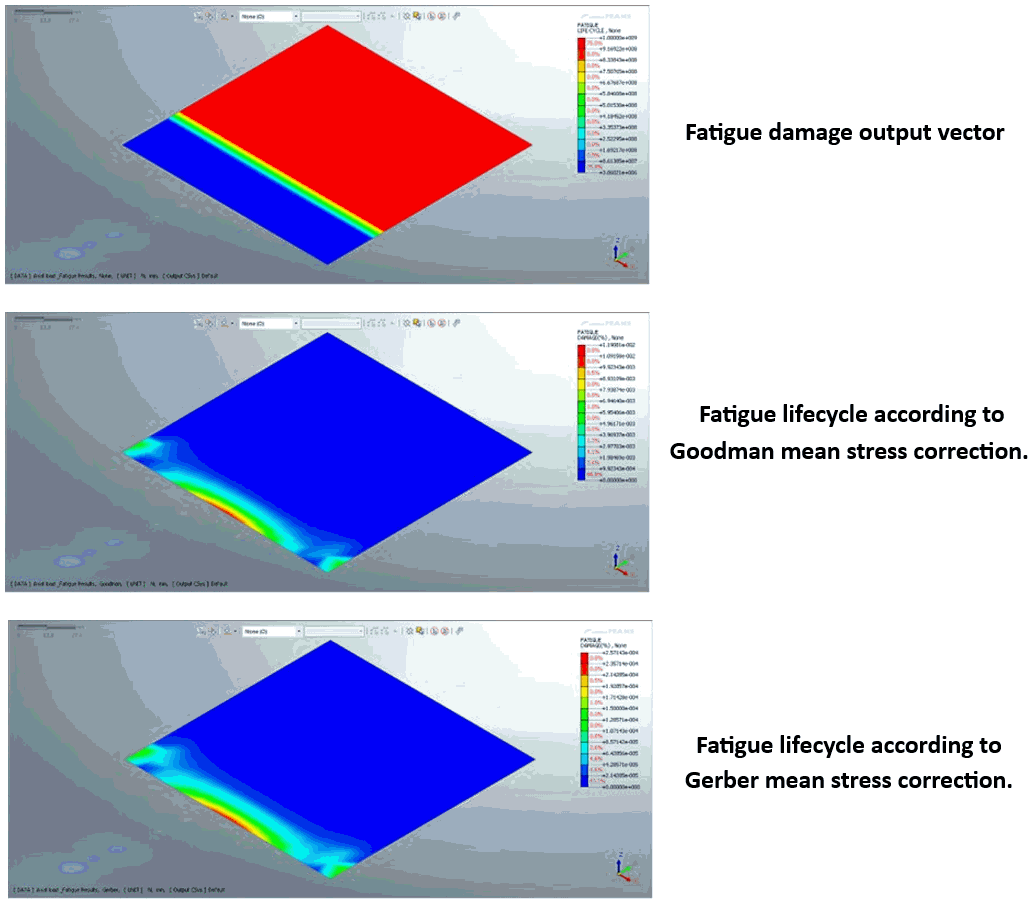
The output results can be
viewed as 1. Damage 2.
Fatigue Life Cycle 3. Contribution of Fatigue;
which are illustrated in the pictures below:
|


