Result Graph
Time variant graphs are generated for the results of time history analysis / equivalent linear analysis.
Applicable Modules:
Ground |
Slope |
Soft Ground |
Foundation |
Seepage |
Dynamic |
From
the Main
Menu, select Results
> Time History Results > Result Graph ![]()
From the Command Line, type 'THResultGraph'
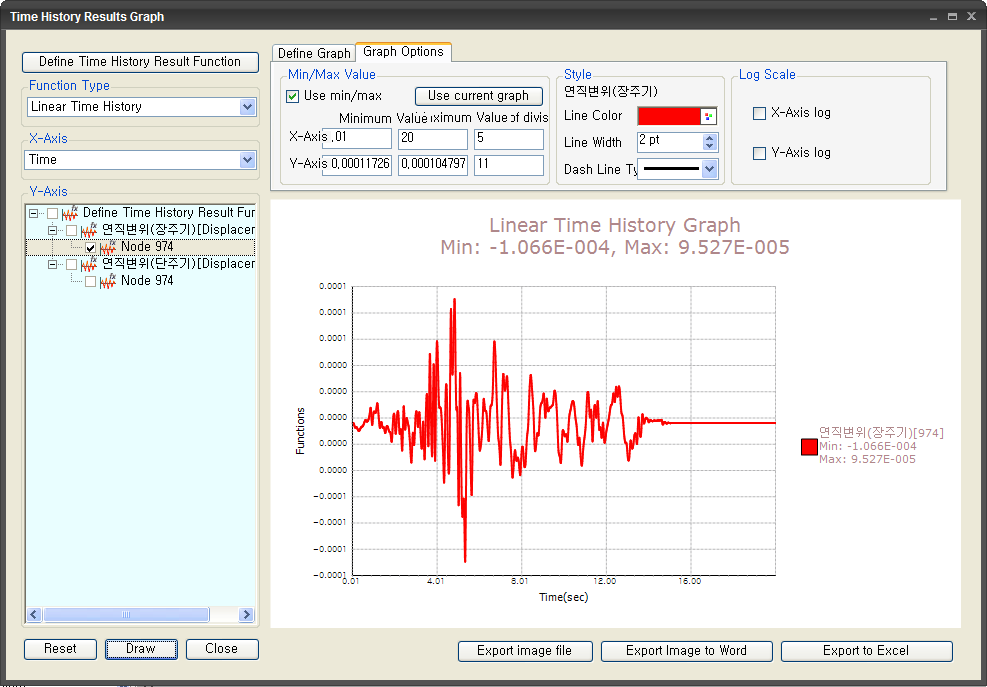
Time History Result Function
Define or modify the settings for generating the results in graphs.
Function Type
Select a function type for the analysis type. (Linear time history, Equivalent linear time history, Response spectrum (Equivalent linear), Fourier amplification (Equivalent linear))
Y axis
Define the output function to be generated on the vertical axis. Result graphs for all the checked functions will be generated.
Graph Option
Use Min / Max
Specify the range of Min / Max values to be applied to the graph.
Use Current Graph
Use the Min / Max range currently shown on the graph.
Min Value
Minimum value of the range of the graph to be generated
Max Value
Maximum value of the range of the graph to be generated
Number of Divisions
Number of divisions between the minimum and maximum values
Graph Style
Line Color
Line Width
Line Dash Type
Log Scale
X-Axis Log
Y-Axis Log
Define Graph
Specify the title of the graph and settings.
Graph Name
X axis Name
Y axis Name
X axis Decimal Point Y axis Decimal Point
If Exp is checked on, the graph will be generated in an exponent type.
![]() The dialog box will be initialized.
The dialog box will be initialized.
![]() The graph of the function clicked on Y axis will be drawn.
The graph of the function clicked on Y axis will be drawn.
![]() Click the ESC key to close the dialog box.
Click the ESC key to close the dialog box.
![]() Image files of the graphs are generated. If 2 or more
functions are selected, an image file for each function is generated,
and a composite graph of all the functions is generated.
Image files of the graphs are generated. If 2 or more
functions are selected, an image file for each function is generated,
and a composite graph of all the functions is generated.
 Image files
of the graphs are generated with word document.
Image files
of the graphs are generated with word document.
 Image files
and function data of the graphs are generated with excel document.
Image files
and function data of the graphs are generated with excel document.