Generate Earthquake Data
Extract and plot graphs of earthquake accelerations, seismic response spectra and design response spectra using the earthquake database built-in SoilWorks.
Applicable Modules:
Ground |
Slope |
Soft Ground |
Foundation |
Seepage |
Dynamic |
From the Main Menu, select Tools > Tools > Generate Earthquake Data
From the Command Line, type 'SeismicDataGenerator' or 'SGS'
File
Print or save all types of data generated in SGS in various formats or open previously generated data.
Generate
Extract and plot graphs of seismic accelerations, seismic response spectra and design response spectra using the earthquake database built in SGS.
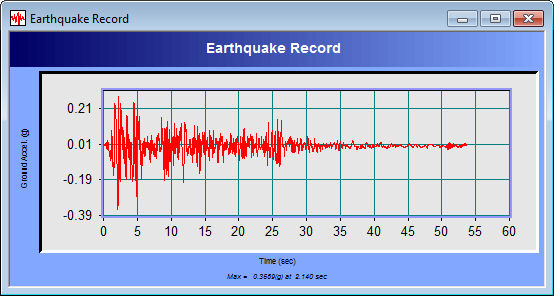
Earthquake Record
Open an earthquake
history record and plot a graph. Select an earthquake wave in
the earthquake field. Enter the scales for the amplitude and time
step, and then click the ![]() button.
button.
All the generated
data are normalized accelerations in g (acceleration of gravity)
and the initial time step is 0.02 sec. Data can also be generated
by changing the time step and amplitude of the original data using
the amplitude and time scales. When data other than the built-in
earthquake history records are to be generated, click the ![]() button to open the data in (*.dbs)
(SGS dbase file).
button to open the data in (*.dbs)
(SGS dbase file).
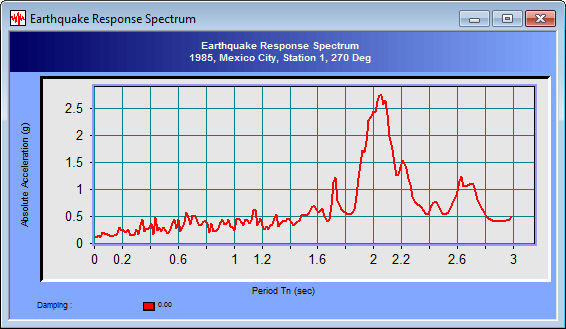
Earthquake Response Spectra
Generate and plot earthquake response spectra from the earthquake history records built in SoilWorks or the seismic wave data previously created by the user.
1. Select a
seismic wave in the Earthquake field. Enter the scales of the
amplitude and time step. When data other than the built-in earthquake
history records are to be generated, click the ![]() button to open the data in (*.dbs) (SGS dbase file)
extension files generated by the user.
button to open the data in (*.dbs) (SGS dbase file)
extension files generated by the user.
2. Enter the
damping ratio. When several graphs for different damping ratios
are to be simultaneously plotted, click the ![]() button to add graphs.
button to add graphs.
3. Enter the period range and intervals for graph generation in Output Period.
4. Select the type of spectrum to be generated from Spectrum Type.
5. Check on X-axis log scale to generate the period intervals along the x-axis in a log scale.
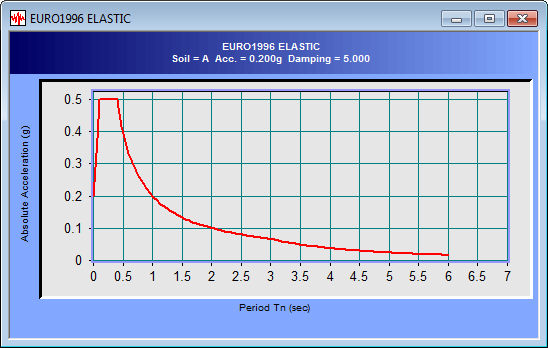
Design Response Spectra
Generate various design response spectra and plot them in graphs.
Enter the necessary
data to generate the design response spectrum and finally the
range of the spectrum periods in the dialog box, and click the
![]() button to generate
the data and plot the graph.
button to generate
the data and plot the graph.
Option
Set options for plotting graphs.
X Scale Log
Display the X-axis of the graph in a log scale.
Y Scale Log
Display the Y-axis of the graph in a log scale.
X Grid
Display gridlines in the X-direction of the graph.
Y Grid
Display gridlines in the Y-direction of the graph.
Diagonal Gird
Display gridlines in the diagonal directions of the graph.
Line Width
Adjust the thickness of graph lines. Convert between bold and thin lines.
Unit
Change the units for the generated data.
Edit Graph Title
Change the title of the graph.
View
Switch between show/hide in the Tool bar and the Status bar. Zooming and change between time and frequency domains can be changed in the graph.
Zoom Out All
When the graph is zoomed in, display the original state. Select the desired part by left-clicking and dragging the mouse to zoom in the window. Right-click the mouse in the graph to restore the magnified part to its original size.
Time<->Frequency
When viewing the earthquake history record in a graph, the graph can be converted between the time domain and frequency domain in X-axis. The frequency domain plot is calculated by FFT (Fast Fourier Transformation).