midas Civil GUI Enhancements
![]() High Graphics (Rendering) Speed
High Graphics (Rendering) Speed
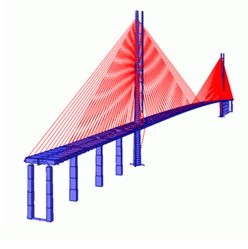
Since midas Civil uses hardware acceleration, the graphic speed is increased considerably. With high graphic speed, rendering, from large solid model to line type element, becomes much faster.
The results shown below are from a test that was carried out under an identical system. The rendering speed can vary from system to system.
|
Model |
Number |
Elapsed Time for Display |
||
|
Nodes |
Elements |
Civil 6.7.1 |
Civil 2006 |
|
|
Solid |
23313 |
88553 |
40 sec |
7 sec |
|
Plate |
46056 |
44136 |
85 sec |
14 sec |
|
Line (Beam or Truss)
|
1878 |
3022 |
7 sec |
2 sec |
|
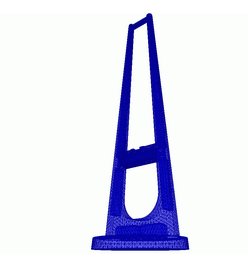
Beam Element |
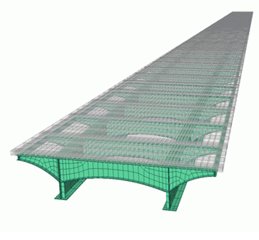
Plate Element |
Solid Model |
Elapsed Time until removing the hidden lines
![]() Render View - Walkthrough Mode
Render View - Walkthrough Mode
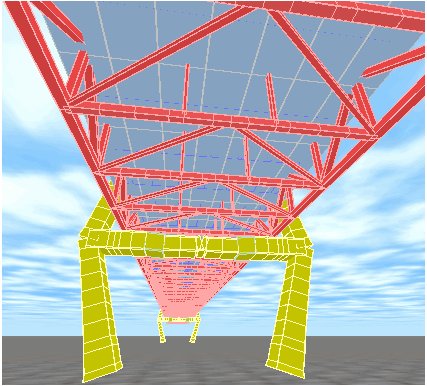
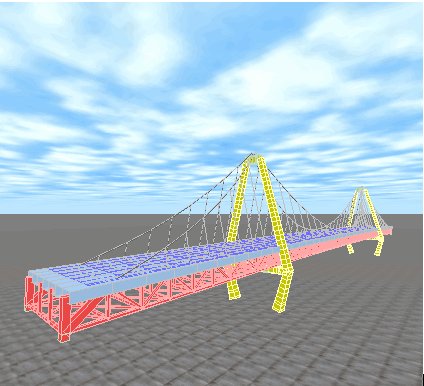
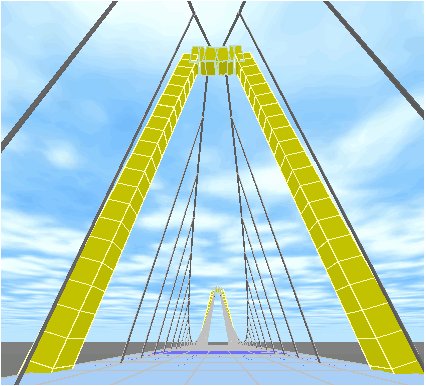
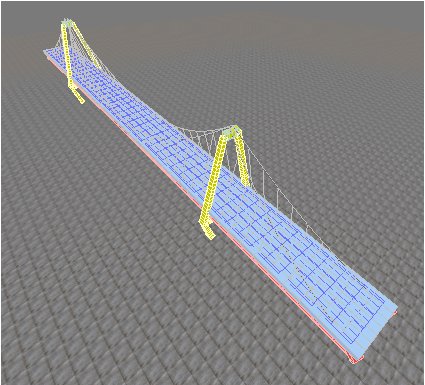
Walkthrough Mode, to complement the existing Flying Mode, has been added. Move upward, downward, left and right, and view changes and movements can be applied separately. While using Walkthrough Mode, viewpoints, the views and moving directions can be freely changed. This allows the user to check/view the model almost realistically.
|
|
|
|
|
|
The usage of "Walkthrough Mode" is as follows:
|
→ |
: Observer rotates to the left in the model. |
|
← |
: Observer rotates to the right in the model. |
|
↑ |
: Observer moves forward. |
|
↓ |
: Observer moves backward. |
|
Drag while left-clicking |
: Observer's view changes upward, downward, left or right without the observer moving. |
|
Drag while right-clicking |
: Observer moves forward, backward, left or right. |
|
Control the speed using +, - keys on the number keyboard. |
|
|
|
|
|
Drag while pressing the mouse wheel: Equivalent to Pan (Observer's viewpoint moves upward, downward, left or right) |
|
Home: Target is set in the center of the screen and the viewpoint moves toward the target.
End: Target is set in the center of the screen and the viewpoint moves away from the target.
In order to view the model more efficiently, move the mouse cursor while pressing the Home/End key to change the target.
![]() Task Pane
Task Pane
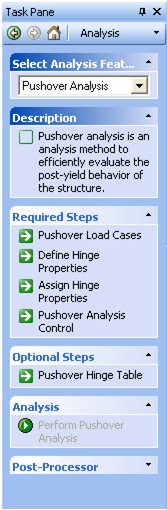
Display work procedure, required input items and optional input items for each analysis case. This helps the user to enter the analysis data easily. Task Pane displays work procedure for advanced analysis functions and description on input items so as to enable the user to work more easily. In addition, Task Pane data can be saved in html format in the User Folder, so that the user can directly write or add the required input items for analysis.
For more details, refer to GUI Information > Task Pane.
![]() Tabbed Tool Bar
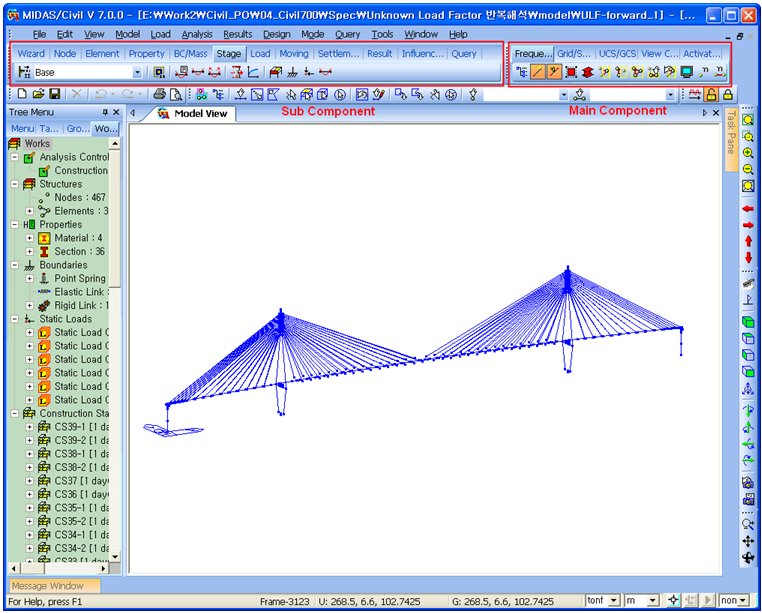
Tabbed Tool Bar
Main component and Sub component Toolbars have been added to the existing Toolbar to group the relevant Icons.
Main component Toolbar provides View and Graphic related Icon Groups and Sub component Toolbar provides Modeling and Post-processor related Icon Groups. Main component and Sub component can be customized as per the preference of the user.
For more details, refer to GUI Information > Toolbar.
![]() Command Line
Command Line
To minimize the movement of mouse, midas Civil adopts a Command Line similar to the one in AutoCAD. This maximizes the efficiency of the modeling and result verification.
Command Line allows the user to quickly and easily gain access to the desired function, since using only the Keyboard input, without using the mouse, enables the user to move to the relevant function or open the relevant window.
In addition, the Command Key can be set from shortcutkey. cmd in the User Folder, as per the preference of the user.
For more details, refer to GUI Information >Command Line.
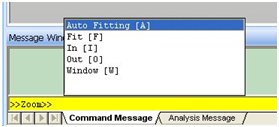
Command Line
![]() Generate Arbitrary Sections
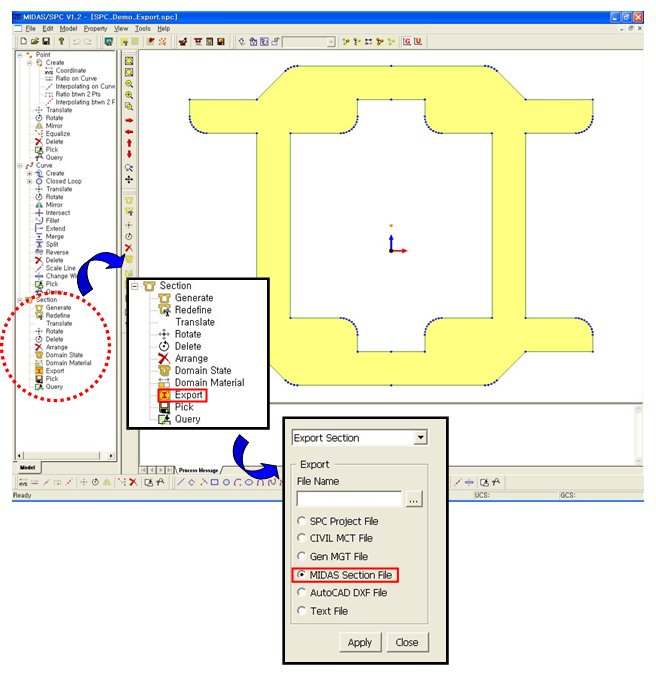
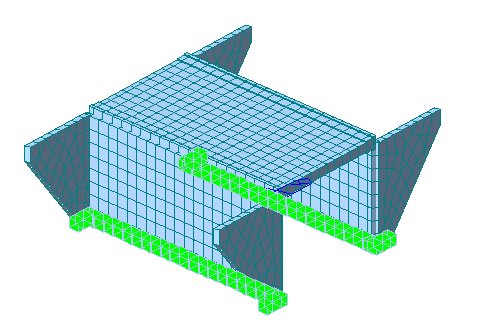
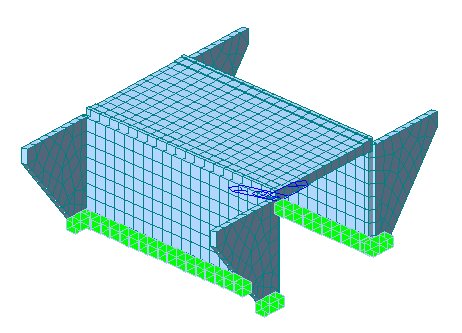
Generate Arbitrary Sections
When the section shapes that are not supported by midas Civil are to be used, generate an arbitrary section to scale in midas Civil using the arbitrary section generation option (midas SPC - convert to midas Section File).
(1) Tools > Sectional Property Calculator
(2) After generating a section, Export > midas Section File
Using midas SPC, generate a user-defined section and export the section to generate *.sec file.
(3) Import SPC
Import *.sec file and save in Section Data.
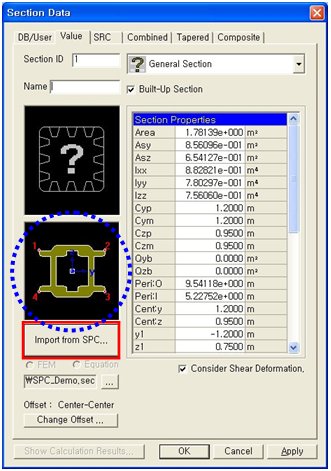
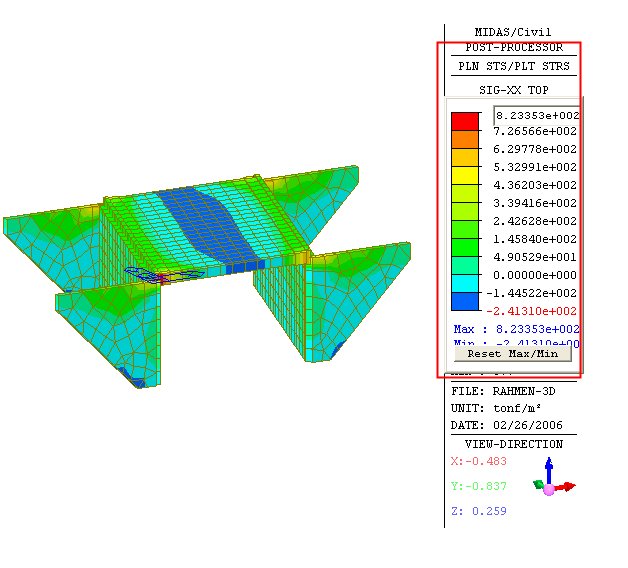
After analysis, visually check the stress distribution in the section.
For more details, refer to Tools > Sectional Property Calculator.
![]() Label Show/Hide
Label Show/Hide
"Hidden Labels" feature has been added to show/hide the boundary symbols, node numbers, etc. that are hidden in the model.
Check on or off the "View > Display > Hidden Labels" option to show/hide the labels.
This feature can be applied to node and element symbol/number, load symbol/value, boundary symbol, etc. In addition, Hidden Labels can be similarly applied to the results display.
Display Hidden Label
Remove Hidden Label
In cases of Frame and Plate elements, when the node and element symbol/number, load symbol/value, boundary symbol, etc. is hidden due to the element thickness and shape, Hidden Labels feature cannot be applied. As shown in the figure below, node B is hidden due to the element shape (Pipe) and node D is hidden due to the element thickness. Hence, the Hidden Labels feature cannot be applied. However, for Solid elements, the Hidden Labels feature is applied even when the node and element symbol/number, load symbol/value, boundary symbol, etc. is hidden.
![]() Legend Range Change
Legend Range Change
The Max and Min values displayed on the Legend can be specified by the user.
If the mouse is clicked on the Legend in the Model Window, Legend becomes active to enable the user to change the Max and Min values. Once the user changes the Max and Min values, other rank values are automatically calculated.
Use ![]() to apply default values.
to apply default values.
![]() Application Look
Application Look
A "Framework Style" has been added to change the Application Look. The user can select the Framework Style by preference.
Application Look can be changed in Window > Application Look. The available Styles are as follows:
- Office 2000 Style
- Office XP Style
- Office 2003 Style (Default)
- Visual Studio.net 2005 Style
- Windows XP Style
![]() Improved Printing Quality
Improved Printing Quality
High resolution printout applying the transparency effect, etc. has been improved, so that the graphics can be printed exactly as shown on the screen. In addition, when printing bmp files, the resolution can be adjusted.
![]() How to Solve a Graphic Problem
How to Solve a Graphic Problem
Since midas Civil uses the Open GL graphic acceleration, the graphics appear as "smooth" even in a large scale model. However, when graphic acceleration cannot be used, the generation of graphics becomes slow, and there is a problem in graphic display.
In such cases, the problem can be solved in the following steps. If the problem is not solved, call or e-mail to MIDASoft.
1. When the PC currently in use has not been set to use the graphic acceleration:
If the graphic speed of Civil is considered to be lower than that in a similar type of PC, check if the graphic acceleration is working.
To check this, click on the Troubleshoot tab in Windows Display Properties>Settings>Advanced and verify if the hardware acceleration is set to "Full" If the hardware acceleration is disabled, enable all accelerations to increase the graphic speed.
2. When the Graphic Card cannot fully support the graphic acceleration:
If the problem is caused by the graphic acceleration while operating Windows Application Programs, it is because the Graphic Card of the PC in use does not fully support the hardware acceleration.
GeForce and ATI series Graphic Cards, which are present in over 90% of PC, have undergone the test successfully. If this problem occurs while using other Graphic Cards, except those mentioned earlier, modify the "Stream Buffer" in midas Civil>Preferences>Environment>Graphics to not use the hardware acceleration function.
midas Civil requires a minimum Graphic Memory of 32MB and a minimum RAM of 512MB.