|

Click the right mouse button on the node/element table to bring up the Context Menu. The functions available in the menu are as follows.
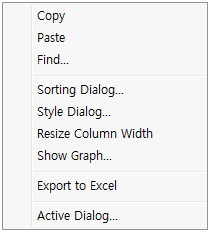
Copy/Paste/Find
Copy the selected area on the table and paste it into a different table on excel or search particular number.
Sorting Dialog
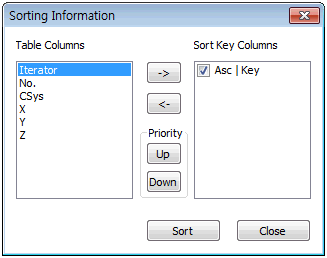
Organize the table information according to a certain principle. Each column title is listed in the Table column and the chosen align principle is moved to the Align key column. The checked Asc in the Align key column organizes in ascending order and the top column on the Align key column is given priority. The priority can be changed by using the Up, Down button.
Style Dialog
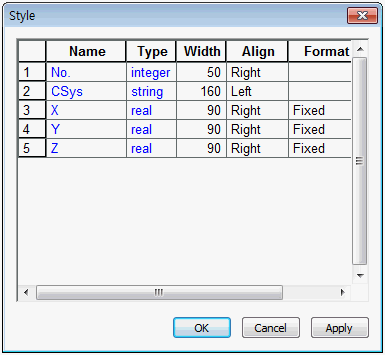
Change the expression style of each data on the table. The name of each column is listed and Integer, real, string is automatically listed for each string type. The width, alignment (Left, Right, Center) format, digits or each column can be set. The data format can be chosen from the 4 options below.
-
Default : The data is expressed in 11 digits.
-
Fixed : The decimal place is specified by the input value.
-
Scientific : The input value is used as the number of significant figures, which are expressed in exp1ntial form. It is useful for expressing very small numerical data such as the permeability coefficient.
-
General : Rounding off at the digit, automatically determined by the program.
Resize Column Width
Minimize the width of each column. It is useful when there are many columns.
Show Graph
Select 2 or more columns to draw a graph. The graph type can be chosen from the 25 built-in options.
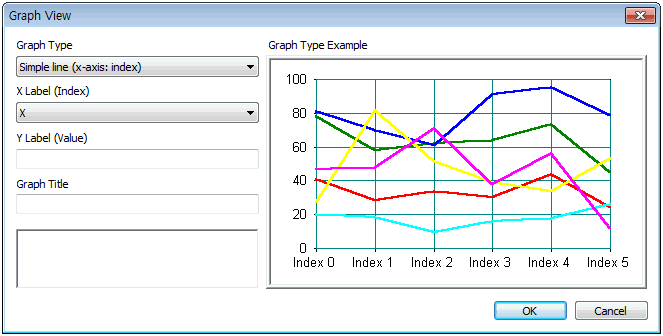
The graph can be drawn by setting the graph type and X axis, Y axis labels and click the right mouse button on the graph table to bring up the Context Menu. The functions available in the menu are as follows.
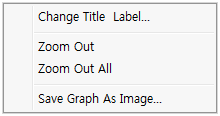
Edit the graph title and the label of each axis. Select an arbitrary point on the graph with the left mouse button and drag to magnify. In this case, use Zoom out to return to the original state. The graph can be saved as an image file (*.bmp, *.jpg. etc.)
Export to Excel / Active Dialog
Auto-save the printed table as an excel file and re-set the mesh set to print the node/element information from using the Active dialog box.
|
