Member Shear Graph


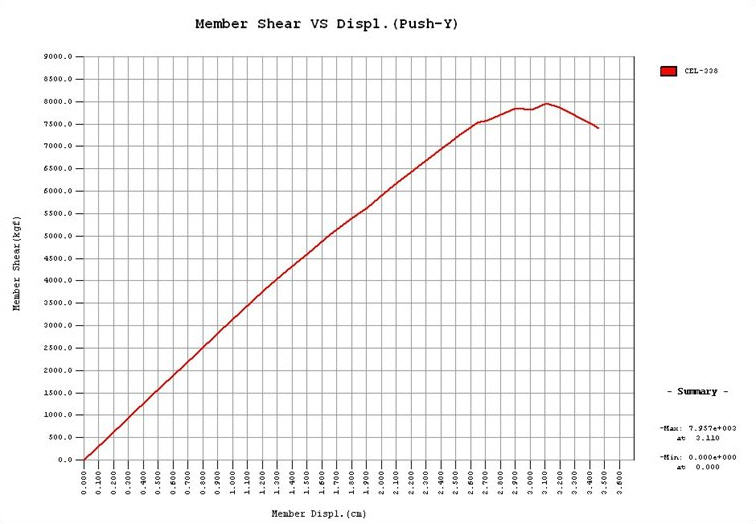
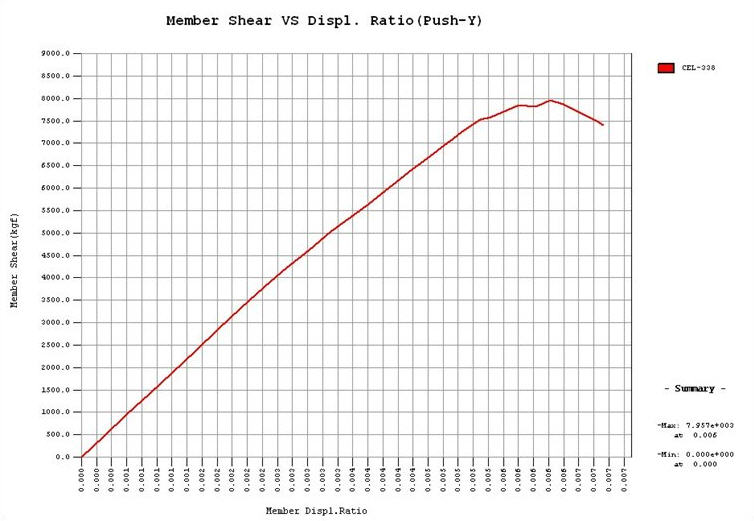
Plot graphs for member shear vs. displacement or member shear vs. displacement ratio to represent the pushover analysis results.


Note
In order to use this function, the Story Shear Force Ratio of Member should be checked on in Model > Building > Control Data of the Main Menu.(default=Check On)


From the Main Menu select Design > Pushover Analysis > Pushover Story Graph >  Member Shear Graph.


This graph can be plotted to check the member shear vs. displacement curve or the member shear vs. displacement ratio curve when the pushover analysis is completed.

Pushover Load Case


Select a pushover load case, which was applied to analysis.


Type of Result


Member shear vs. Displacement or Member shear vs. Displacement ratio (Multiple selections are possible)


Element


Enter an element number to select the element to be checked. (User input or Selection)


Type of Display


Assign decimal points to be displayed on the axes (including exponentials).


Right click on the graph displayed on the screen to prompt the Context Menu. Using the Context Menu, various graphs can be expressed and data and images can be saved.


Change Title & Label

The title and subtitles to the x & y-axes may be changed.


Draw Gray & Color Graph

Draw the graph in gray or in color. (Default=Color Graph)


Save Graph As Image

Save the graph in the graphic file format of BMP, JPG or EMF. (default=BMP image)


Save Graph As Text

Save the graph in the format of a text file.


Save Graph As Excel

Export the graph data in the format of Excel Sheet.


Note 1

Evaluate member ductility demand from the member shear vs. displacement curve.


Member Shear Graph (Member Shear VS Displ.)


Member Shear Graph (Member Shear VS Displ. Ratio)
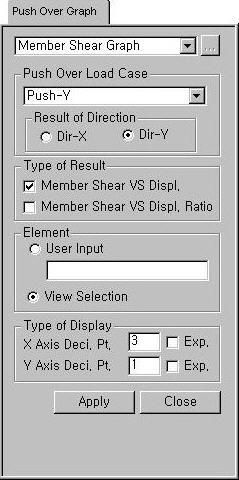