Define Point Grid
|
|
|
|
|
|
Assign the spacings and display area of point grids.
Point grids are displayed according to the initial preferences setting in Environment View of Tools > Preference. Use the function to change the preferences temporarily.
Point grids are displayed in the UCS x-y plane. Use View
> Grids to display or not to display the point grids. Use the
function in conjunction with |
|
|
|
|
|
|
|
From the Main Menu select Model > Grids > Point Grid.
Select Geometry > Grids > Point Grid in the Menu tab of the Tree Menu.
Click |
|
|
|
|
|
Point Grid dialog box
|
|
|

 Set Point Grid
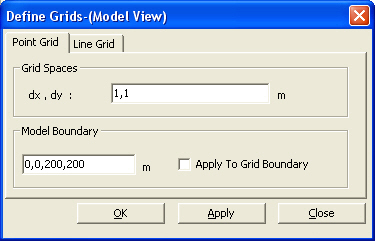
 Grid Spaces