Plate Forces/Moments
| ||||||||||||||||||||
|
| ||||||||||||||||||||
|
| ||||||||||||||||||||
|
Check the internal force influence line of a plate element. | ||||||||||||||||||||
|
| ||||||||||||||||||||
|
| ||||||||||||||||||||
|
| ||||||||||||||||||||
|
From the Main Menu select Results > Influence Lines > Plate Forces/Moments.
Select Results > Influence Lines > Plate Forces/Moments in the Menu tab of the Tree Menu.
Click | ||||||||||||||||||||
|
| ||||||||||||||||||||
|
| ||||||||||||||||||||
|
|
 Plate Forces/Moments
|
|
|
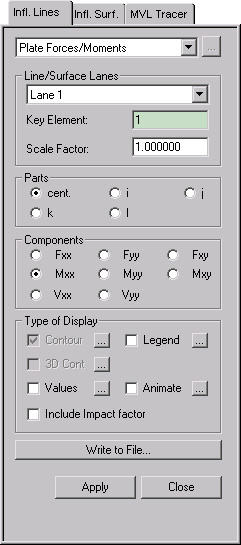
 Type of Display
Assign the type of display.
|
Contour |
Display the plate element's internal force influence line in contour. |
|
|
Ranges: Define the contour ranges.
Note
Number of
Colors: Assign the number of colors to be included in the contour
(select among 6, 12, 18, 24 colors) Colors: Assign or control the colors of the contour.
Color Table: Assign the type of Colors.
Reverse Contour: Check on to reverse the sequence of color variation in the contour.
Contour Line: Assign the boundary line color of the contour
Element
Edge: Assign the color of element edges while displaying the contour Contour Options: Specify options for contour representation
Contour Fill
Gradient
Fill: Display color gradient (shading) in the contour.
Draw Contour
Line Only
Mono line: Display the boundaries of the contour in a mono color.
Contour
Annotation
Spacing: Specify the spacing of the legend or annotation.
Coarse Contour
(faster) (for large plate or solid
model)
Extrude The option is not concurrently applicable with the Deformed Shape option. Similarly, the option cannot be concurrently applied to the cases where the Hidden option is used to display plate element thicknesses or the Both option is used to represent Top & Bottom member forces (stresses). |

 : Assign the color distribution
range of contour. Using the function, specific colors for specific ranges
can be assigned.
: Assign the color distribution
range of contour. Using the function, specific colors for specific ranges
can be assigned. : Control the colors by zones
in the contour.
: Control the colors by zones
in the contour.|
Legend |
Display various references related to analysis results to the right or left of the working window. |
|
|
Legend Position: Position of the legend in the display window |
|
Values |
Display the internal force influence line in numerical values. The font and color of the numbers can be
controlled in |
|
|
Decimal
Points: Assign decimal points for the displayed numbers Min &
Max: Display the maximum, minimum values Set Orientation: Display orientation of numerical values
Note |

|
Animate |
Dynamically simulate the variation of internal forces and deformed shapes due to the moving load.
Click |
|
|
Animation Mode: Select the type of animation for analysis results.
Animate
Contour: Option to change the color of the contour representing
the transition according to the magnitudes of variation
Note AVI Options: Enter the options required to produce the animation window.
Bits per
Pixel: Number of bits per pixel to create the default window for
animation Construction Stage Option: Select the animation options when the construction stage analysis is performed.
Stage Animation:
Animations by construction stages |
 then click
  Record to the right of the Animation control board at the
bottom of the working window.
Record to the right of the Animation control board at the
bottom of the working window. : Assign the method of compressing image data
|
Include Impact Factor |
Reflect the impact factor in the display. |
 : Save the results displayed
in the current model window as a text file
: Save the results displayed
in the current model window as a text file