Nodal Results of Response Spectrum
| ||||||||||||||||||||||||
|
| ||||||||||||||||||||||||
|
| ||||||||||||||||||||||||
|
Display inertia forces and accelerations from response spectrum analysis at each node of a structure.
Note This function is activated when masses are entered as "Lumped Mass Type" which will be used for Eigenvalue analysis. | ||||||||||||||||||||||||
|
| ||||||||||||||||||||||||
|
| ||||||||||||||||||||||||
|
| ||||||||||||||||||||||||
|
From the Main Menu select Results >Nodal Results of RS.
Select Results > Nodal Results of RS in the Menu tab of the Tree Menu. | ||||||||||||||||||||||||
|
| ||||||||||||||||||||||||
|
| ||||||||||||||||||||||||
|
|
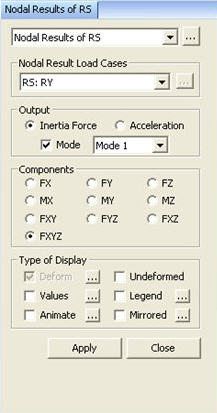
 Load Cases/Combinations
|
Deform |
Display the deformed shape of the model. |
|
|
Deformation Scale Factor Magnify or reduce the size of the displacement graphically displayed in the model window.
Beam Deformation Select the type of displacement display.
Nodal Deform: Display the deformed shape representing only the nodal displacements.
Real Deform: Display the detail deformed shape including the calculated displacements along the sections between the end nodes in addition to the nodal displacements for beam elements.
Real Displacement (Auto-Scale off) The true deformation of the structure is graphically represented without magnifying or reducing it. This option is typically used for geometric nonlinear analysis reflecting large displacement.
Relative Displacement The deformation of the structure is graphically represented relative to the minimum nodal displacement, which is set to "0" |

|
Undeformed |
Overlap the undeformed and deformed shapes of the model. |
|
Values |
Display the inertia forces and accelerations in numerical values. The font and color of the numbers can be
controlled in |
|
|
Decimal
Points: Assign decimal points for the displayed numbers Min &
Max: Display the maximum and minimum values
Set Orientation: Display orientation of numerical values
Note |

|
Legend |
Display various references related to analysis results to the right or left of the working window.
Element numbers pertaining to the maximum and minimum forces are displayed. |
|
|
Legend Position: Position of the legend in the display window
Rank Value Type: Specify a type of values in the Legend and the number of decimal points. |
|
Animate |
Dynamically simulate the transition process. Click |
|
|
Animation Mode: Select the type of animation for analysis results.
Animate
Contour: Option to change the color of the contour representing
the transition according to the magnitudes of variation
Note AVI Options: Enter the options required to produce the animation window.
Bits per
Pixel: Number of bits per pixel to create the default window for
animation
Construction Stage Option: Select the animation options when the construction stage analysis is performed.
Stage Animation: Animations by construction stages
Current Stage-Step: Animations by Steps in the current construction stage
From ~ To: Starting and ending construction stages or steps for animations |
|
Mirrored
|
"Mirrored" allows the user to expand the analysis results obtained from a half or quarter model into the results for the full model by reflecting planes. |
|
|
Half Model Mirroring
Quarter Model Mirroring
Mirror by: Specify the mirror plane (s) by designating a plane and a coordinate in the direction perpendicular to the plane in GCS. |
 then click
  Record to the right of the Animation control board at the
bottom of the working window.
Record to the right of the Animation control board at the
bottom of the working window. : Assign the method of the compressing image data