Story Shear Force Ratio
| ||||||||||||||
|
| ||||||||||||||
|
| ||||||||||||||
|
Produce graphs for column shortening of a highrise structure resulting from a construction stage analysis. | ||||||||||||||
|
| ||||||||||||||
|
| ||||||||||||||
|
| ||||||||||||||
|
From the Main Menu select Results > Story Shear Force Ratio
Select Results > Story Shear Force Ratio in the Menu tab of the Tree Menu. | ||||||||||||||
|
| ||||||||||||||
|
| ||||||||||||||
|
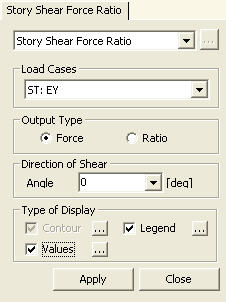
 Load Cases
|
Contour |
Display the displacement of the model in contour. |
|
|
Ranges: Define the contour ranges.
Note
Number of
Colors: Assign the number of colors to be included in the contour
(select among 6, 12, 18, 24 colors) Colors: Assign or control the colors of the displacement contour.
Color Table: Assign the type of Colors.
Reverse Contour: Check on to reverse the sequence of color variation in the contour.
Contour Line: Assign the boundary line color of the contour
Element
Edge: Assign the color of element edges while displaying the contour Contour Options: Specify options for contour representation
Contour Fill
Gradient
Fill: Display color gradient (shading) in the contour.
Draw Contour
Line Only
Mono line: Display the boundaries of the contour in a mono color.
Contour
Annotation
Spacing
Coarse Contour
(faster) (for large plate or solid
model) |

 : Assign the color distribution
range of contour. Using the function, specific colors for specific ranges
can be assigned.
: Assign the color distribution
range of contour. Using the function, specific colors for specific ranges
can be assigned. : Control the colors by zones
in the contour.
: Control the colors by zones
in the contour.|
Legend |
Display various references related to analysis results to the right or left of the working window.
Element numbers pertaining to the maximum and minimum forces are displayed. |
|
|
Legend Position : Position of the legend in the display window
Rank Value Type: Specify a type of values in the Legend and the number of decimal points. |
|
Values |
Display the nodal displacements in numerical values. The font and color of the numbers can be
controlled in |
|
|
Decimal
Points: Assign decimal points for the displayed numbers
Set Orientation: Display orientation of numerical values
Note |
