Select the functions to be plotted in a graph
from the list of the defined functions. Multiple functions can be plotted
on a single graph for comparative purposes.
Vertical Axis
Select the item corresponding to the vertical
axis of the graph.
Horizontal Axis
Select the item corresponding to the horizontal
axis of the graph. The item that can be selected is one of Pushover Increment
Step and the functions listed in Define Function.
Type of Display
Enter a title of the pushover analysis result
graph and a format of output for axes.
Graph Title
: Title of Pushover analysis result graph
X-Axis Deci.
Pt.(Exp) : Decimal points and whether to
express in exponents for X-axis of the graph
Y-Axis Deci.
Pt.(Exp) : Decimal points and whether to express in exponents for
Y-axis of the graph
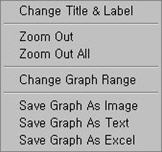
Context Manu
Right click on the graph displayed on the
screen to prompt the following Context Menu.
Change Title
& Label : The title and subtitles to the x & y-axes may
be changed.
Zoom Out
: Drag the mouse over the part that is of interest to zoom in and click
Zoom Out to restore the view.
Zoom Out
All : Restore the very initial view of the graph. That is, revert
to the view that contains all the ranges.
Change Graph
Range: Modifies the range for displaying the graph.
Save Graph
As Image : Save the graph in the graphic file format of BMP, JPG
or EMF. (default=BMP image)
Save Graph
As Text : Save the graph in the format of a text file.
Save Graph
As Excel : Save the graph in the format of a excel file.
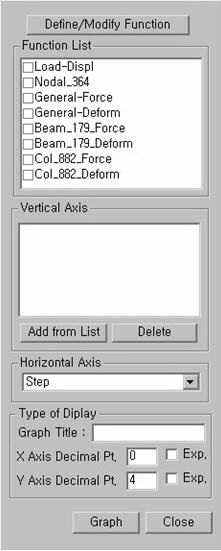
 Define/Modify Function