Pushover Curve
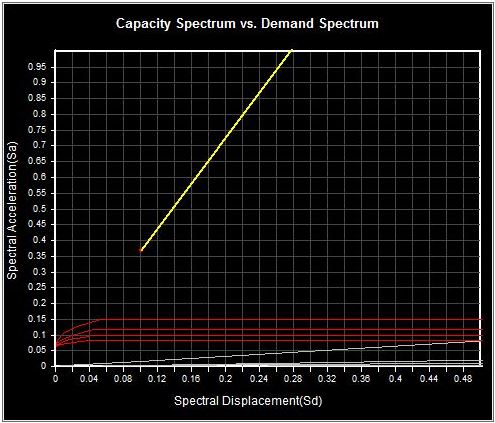
Using the interaction of the base shear and the displacements calculated from the results of a Pushover analysis, the capacity curve and capacity spectrum of a structure are calculated. The demand spectrum is also generated for a design seismic load using the design response spectrum.
The Performance Point, which represents the state of maximum inelastic capacity of the structure, is found through the cross point of the Capacity Spectrum and Demand Spectrum for a given damping ratio.
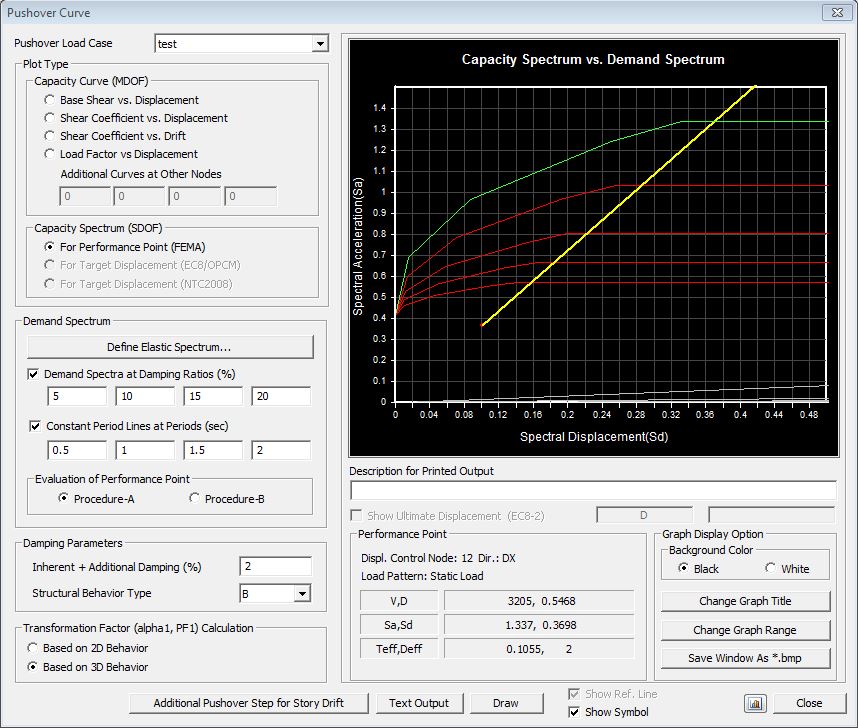
From the Main Menu select Pushover > Pushover Result > Pushover Curve.
 Pushover Load Case
Select a load case applied to pushover analysis.
Note
If Pushover Load Case acting in GCS Z-direction is specified, only Load Factor vs. Displacement becomes activated in Plot Type.
Plot Type
Select the type of pushover result curve to be produced.
Capacity Curve (MDOF)
Base Shear vs. Displacement
Shear Coefficient vs. Displacement: Shear coefficient (Lateral load/Total weight) vs. Displacement
Shear Coefficient vs. Drift: Shear coefficient vs. inter-story Drift
Load Factor vs. Displacement
Note 1
If Load Factor vs. Displacement is specified in Plot Type, Capacity Spectrum becomes inactivated.
Note 2
Pushover Curve due to vertical (gravity) load can be produced. An example of application may be an arch structure subjected to vertical displacement in relation to the total reaction.
Additional Curves at other Nodes: Nodes numbers for which additional curves will be produced
Capacity Spectrum (SDOF)
For Performance Point (FEMA) : Load (Base Shear) - Displacement of the pushover analysis is transformed into the Spectral Acceleration (Sa) vs. Spectral Displacement (Sd) curve.
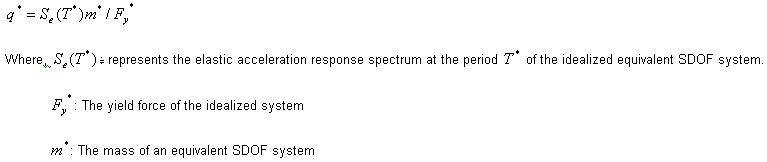
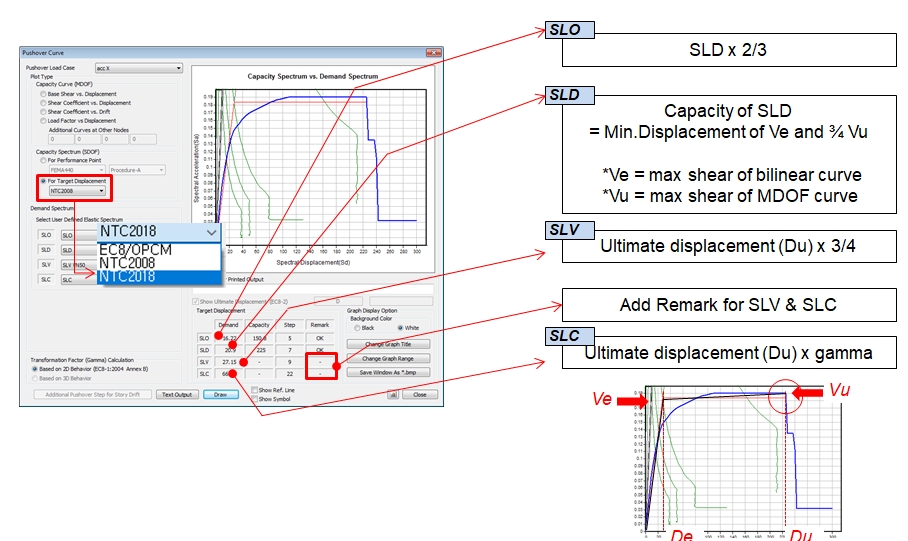
For Target Displacement (EC8/Masonry): Target displacement is a the seismic demand derived from the elastic response spectrum considered in terms of the displacement of an equivalent single-degree-of-freedom system.
![]() Show Ultimate
Displacement (EC8-2)
Show Ultimate
Displacement (EC8-2)
Display the ultimate displacement which is 80% from the maximum base shear.
Additional Pushover Step for
Story Drift
Define the additional pushover steps in order to check the pushover analysis results for the steps which have not been defined in Pushover Load Case. [Details ]
Text Output
Pushover analysis result graphs can be saved as text files.
Note
When Performance Point is found, an additional step for Performance Point is added in text file.
Draw
Display Capacity Spectrum produced by Performance Point / Target Displacement.
Note
If the user click on Draw button, an additional step for Performance Point is added into Additional Step dialog box.
Graph Display Option
Background Color Set the background color for the plotted graph.
Black: Set the background to black.
White: Set the background to white.
Change Graph Title The graph title can be changed.
Change Graph Range Define the ranges of the X & Y-axes.
Save Window As *.bmp Save the graph in the graphic file format of BMP.
Show Symbol Display each increment steps in Pushover Curve.
Show Reference Line Display the demand corresponding to DL, SD & NC of Target Displacement in Pushover Curve. |
![]() Revision of Gen 2014 (v1.1)
Revision of Gen 2014 (v1.1)