Ground stress-strain behavior
becomes nonlinear as it approaches the yield criterion;
nonlinear elastic models simulate such ground behavior
by modifying the foundation modulus. The function proposed
by Duncan and Chang (1970) is used to calculate the foundation
modulus. The stress-strain curve of the function is a
hyperbola and the foundation modulus is a function of
confining stress and shear stress. This nonlinear elastic
material model is very useful because it only needs material
properties that can be easily obtained from the triaxial
compression test or literature. The Duncan and Change
nonlinear stress-strain curve represents a hyperbola between
the axial strain space generated by shear stress ( ) and it can be defined according to stress
state and stress path by 3 foundation moduli (Initial
modulus ) and it can be defined according to stress
state and stress path by 3 foundation moduli (Initial
modulus  , Tangent
modulus , Tangent
modulus  , Unloading-reloading
modulus , Unloading-reloading
modulus  ). ).
The main nonlinear parameters of the hyperbolic model
are as follows.
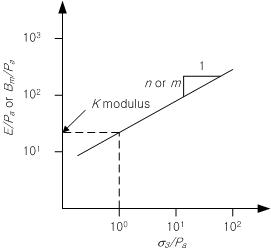
The results of the triaxial compression test can be
plotted on a vertical axis of  or or
 and a horizontal axis of and a horizontal axis of  . Set each axis to a log scale and the vertical
axis value at . Set each axis to a log scale and the vertical
axis value at  =1 is the Initial Loading
Modulus (K). The
Initial Stiffness Exp1nt(n) can be found from the
slope when the vertical axis is
=1 is the Initial Loading
Modulus (K). The
Initial Stiffness Exp1nt(n) can be found from the
slope when the vertical axis is  and the Bulk Modulus
Exp1nt(m) can be found from the slope when the
vertical axis is
and the Bulk Modulus
Exp1nt(m) can be found from the slope when the
vertical axis is  .
Here, the Bulk modulus Bm is defined by the following
equation and can be predicted using the relationship with
Poisson’s ratio. Here, the Poisson’s ratio is limited
to values within 0 to 0.5. .
Here, the Bulk modulus Bm is defined by the following
equation and can be predicted using the relationship with
Poisson’s ratio. Here, the Poisson’s ratio is limited
to values within 0 to 0.5.
 : Amount of principal
stress change, : Amount of principal
stress change,
 : Amount of volume
strain change : Amount of volume
strain change

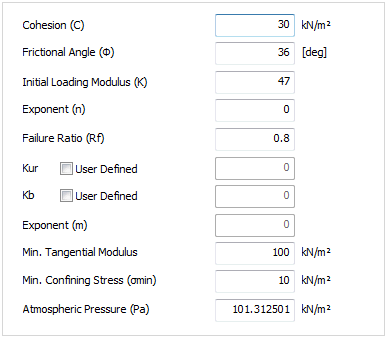
<Set material property>

The Duncan and Change nonlinear stress-strain curve
can be defined according to stress state and stress path
by 3 foundation moduli (Initial modulus , Tangent modulus ,
Unloading-reloading modulus ).
, Tangent modulus ,
Unloading-reloading modulus ).
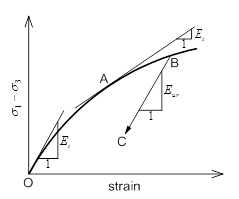
<Nonlinear stress-strain behavior>
Here, the Failure Ratio
(Rf) can be found by the relationship between the
Initial modulus
and Tangent modulus
. The ratio of failure is the ratio between the asymptote
of the hyperbola and the maximum shear strength and has
a value between 0.75~1. A convergence problem can occur
when the Tangent modulus is
too small and so the minimum Tangent modulus value is
set as the atmospheric pressure (Pa). Bulk
modulus number (Kb) can be calculated from the
Bulk modulus (Bm) and Bulk modulus index (m).
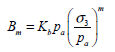
Here,
 : Bulk modulus, : Bulk modulus,
 : Bulk modulus
number, : Bulk modulus
number,
 : Bulk
modulus index : Bulk
modulus index
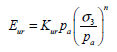
Unloading-reloading modulus number  can be calculated from the unloading-reloading ratio
 . .
If the confining stress is '0(zero)' or negative (tensile
state) when calculating the initial moduli, the moduli
can be '0(zero)' or a negative value. Hence, a lower bound
needs to be set for the confining stress and the set Minimum confining pressure
is 0.01Pa.
The suggested parameter values depending on the density
of sandy soils are as follows. (Duncan, J. M. and Chan,
C. Y. (1970))
Relative
density |

|

|

|

|

|
100%
(dense) |
36.5 |
0.91 |
2000 |
2120 |
0.54 |
38%
(loose) |
30.4 |
0.90 |
295 |
1090 |
0.65 |
 for
dense and loose sand for
dense and loose sand
|
 , , :
Dry state friction angle and cohesion :
Dry state friction angle and cohesion
<Table. Summary of stress-strain
parameters for uniform fine silica sand>
|