Settlement Profile: Plot Settlement Profile
![]()
Function
Plot Settlement Profile Grid outputs a diagram or a contour of results on the virtual grid which is defined in Define Settlement Profile Grid.
Call
Result > Settlement Profile > Plot Settlement Profile
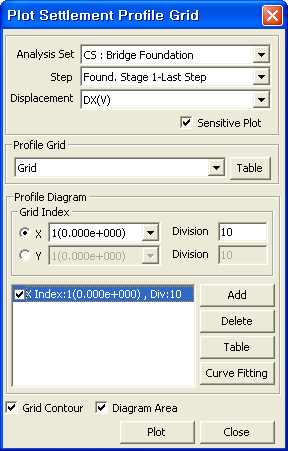
<Plot Settlement Profile Grid dialog box>
Analysis Set
Select
an Analysis Set for which the results for settlement profile have been
generated.
Step
Select
the steps of the results for settlement profile.
Displacement
Select
the displacement component.
Profile Grid
Include
the list of defined grids.
Table
Output
the results at the grid points in a table format.
Profile Diagram
Grid index
X
Select grids of X-direction from the list for displaying the diagrams.
Y
Select grids of Y-direction from the list for displaying the diagrams.
Division
Enter
the number of divisions for the diagram.
Add
Include
the defined diagram in the list.
Delete
Delete the selected diagram in the list.
Table
Output the selected diagrams in a table format.
Curve Fitting
Define
an interpolation curve between grid points with a polynomial function.
Polynomial Order
Specify
the order of the polynomial function.
Position
Specify
the location for the calculations.
Displacement
Enter the displacement.
Displacement Incline
Enter the increment of displacement.
F(x) Coefficient
It displays the coefficient of the polynomial function.
F'(x) Coefficient
It displays the differential coefficient of the polynomial function
.
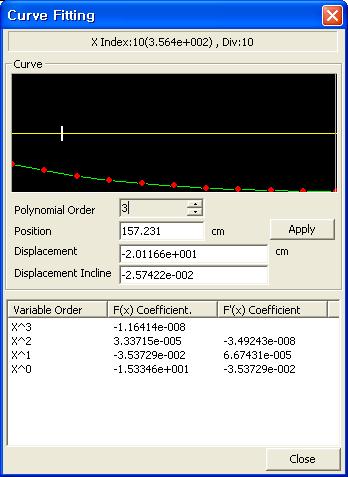
<Curve Fitting dialog box>
Grid Contour
It
displays the contour on the virtual grid.
Diagram Area
It displays the area of the diagram on the screen.