Design
Response Spectra
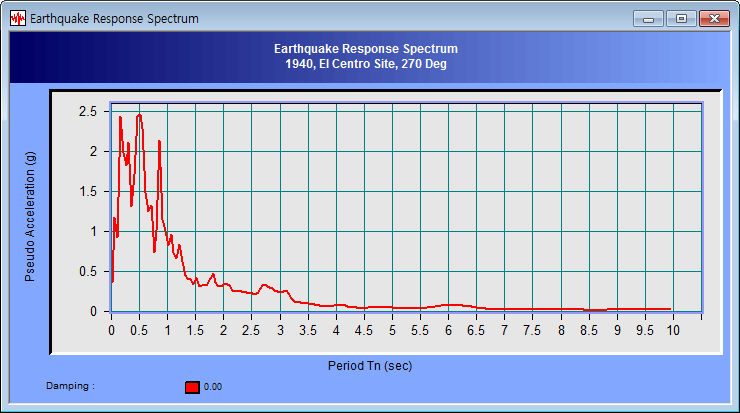
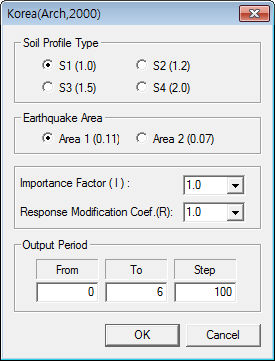
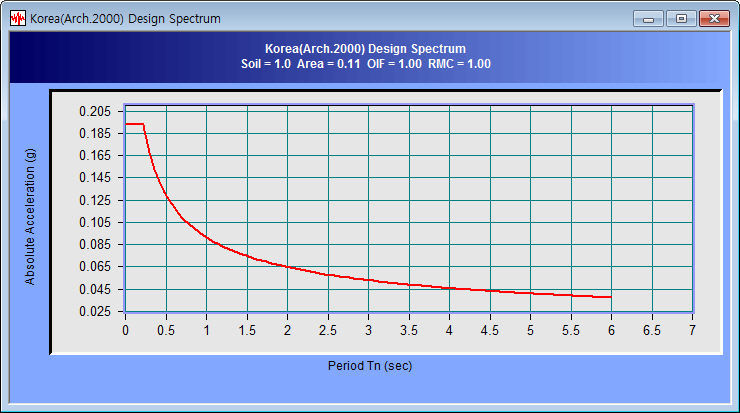
Create a Design Response
Spectra and display as a graph.
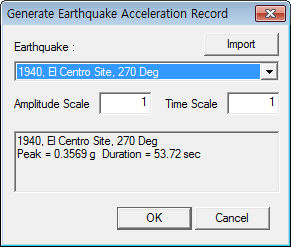
Input the data necessary
for spectra creation on the dialog box, input
the spectrum period range and click the [OK] button
to display the graph.
Option
Set various options
for the graph. The graph x axis and y axis can
be displayed in log scale. The scale marks can
be displayed. The thickness of the graph line
can be modified and the graph title can also be
modified.
View
Change the show/hide
status of the tool bar or status bar. Also, the
Zoom function for the graph and the Time Domain
and Frequency Domain of the graph can be modified.
Zoom
Out All
Return from the zoomed
state to the original state.
To magnify a section
of the graph, drag and select the desired section
using the left mouse button. The right mouse button
can be used to return the view state to the original
state.
Time<->Frequency
Convert the graph
x axis from the time domain to the frequency domain
and vice versa. |