General
[General]
Application : Specify the user name,
company name, temporary file folder, file
save interval, etc. License : Authorize the program license.
The Stand Alone (USB Hard lock) method and
the Web Authorization method are supported. Unit system : Specify the force/length/time
unit system used for analysis. Use the Unit
converter at the bottom right to convert the
units before or after analysis.
[Graphic]
- The mouse operation
can be used to fit the utilized 3D CAD wheel operation.
- The Smoothing Surface
Rendering method regulates the edge line tessellation
of a cylinder shaped curved surface. The available
levels are from 1 to 5, with a higher quality
and smoother surface as the level gets higher.
- The Shape of the
Dynamic View is the option for the displayed modeling
shape on the work window during view rotation.
Selection : Specify the options for
the model part. Guider : Specify the options for the
screen guider. Geometry shape : Specify the color for
each geometry shape type. Element : Specify the color for each
element type. Advanced : Adjust the advanced options
for the graphic setting. It determines whether
to show the shadow and controls its shade.
The available levels are from 1 to 5, with
darker information shown as the level gets
higher.
Geometry/Mesh/Connect
[Geometry]
[Mesh Set]
Load/Boundary Condition
[Coordinate system] : Specify the color of the
coordinate system symbol. Symbol 1, Symbol 2,
and Symbol 3 represent the X axis, Y axis, and
Z axis respectively.
[Mesh] : Specify the size of the node and element
number.
[Static load] : Specify the size and color of
the static load symbol.
[Dynamic load] : Specify the size and color
of the dynamic load symbol.
[Boundary condition] : Specify the color of
the boundary condition symbol..
[Result]
General : Input an analysis result that
is extremely small and can be considered as
0. The default value is set as 1e-12, and
results lower than this value is considered
as 0. Contour : Determine the various settings
for contour representation of analysis results. Vector : Display results that are represented
with a (V) using vectors. Here, specify how
to represent the vectors. Deform : Specify the basic settings
for checking the deformed shape of analysis
results. No result entity : Specify how to represent
the no result entities when displaying analysis
results. Diagram : Determine the basic settings
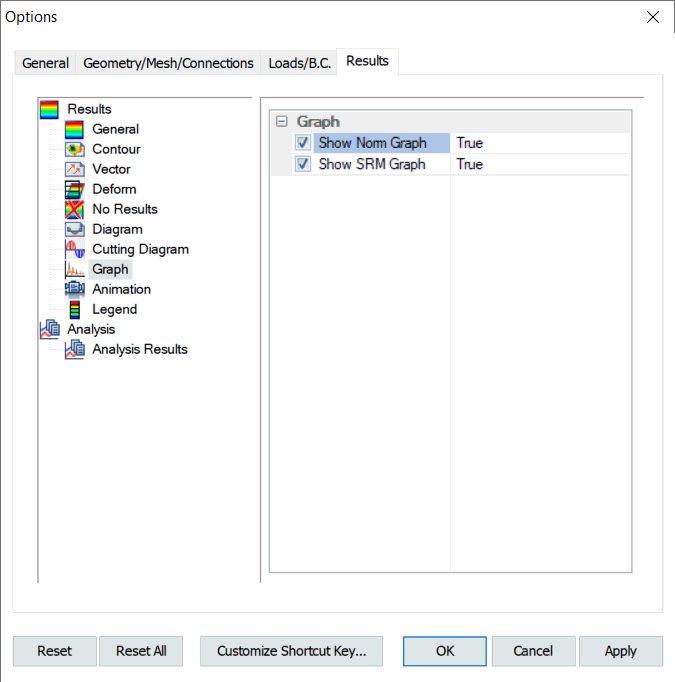
for diagrams. Graph : Select/Deselect display of graphs,
the user has the option of checking Norm Graphs
(Work/Load/Displacement VS Iteration) &
SRM Graphs. Animation : Specify the location in
which the animation image types and files
are saved. Legend : Specify the background color
and number of result bands displayed on the
screen. Analysis Results: Select/deselect the
results which the user does not want to check,
this saves the total computation time and
also the storage space required for running
a model.

Customize Shortcut
Key
The user can call up frequently used commands
by defining a shortcut key. |


