The
following process can be performed to output the history
result graphs for all time variant analysis methods. The
printable history results include ground deformation,
member force and seepage results.
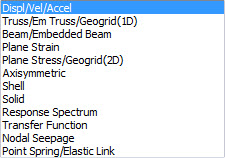
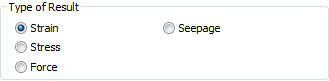
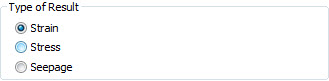
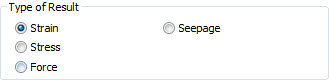
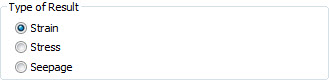
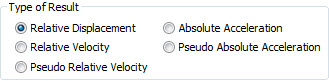
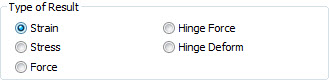
1. Select the Probe type (Analysis
> History > History Output Probes > Probe Type)
and select the Object to check the result
<History result search and search
type >
Probe
Type |
Type
Of Result |
Displ/Vel/Accel |
|
Truss/Em
Truss/Geogrid(1D) |
|
Beam/Embedded
Beam |
|
Plane
Strain |

|
Plane
Stress/Geogrid (2D) |
|
Axisymmetric |
|
Shell |
|
Solid |
|
Response
Spectrum |
|
Transfer Function |

|
Nodal
Seepage |
-
|
Point
Spring/Elastic Link |
|
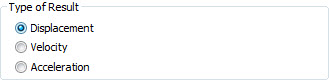
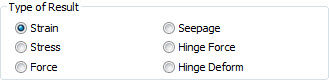
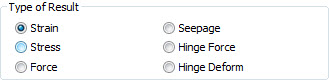
This feature can be specified
for each search type and the detailed components are selected.
For element results, the results can be output for the
selected node center or for each node position. However,
the middle nodes of higher order elements cannot output
results. For the 'Displacement/Velocity/Acceleration'
type, the results calculated at the [Reference Node] can
be used to deduct relative results. In case of 'Transfer
Function', it has always a relative result, the user must
specify the [Reference Node].
[History step] specifies the
step at which the results will be output. Select [All
Output Step] to output results at all the time intervals,
not just at the output time steps specified in the Analysis
case. Specify the [Frequency] option when printing the
results at analysis conducting step/time intervals. For
an example analysis case with an analysis time increment
as 0.1,0.2,0.3 sec... and an interim result output time
as 0.3,0.6sec..., specifying 'Step : 2' outputs the results
at 0.2, 0.4, 0.6sec... . Entering '0.2sec' in the 'Time'
option can output the results at 0.2, 0.4, 0.6sec... .
※
Be careful not to reflect search types that are not printed
in the Analysis case.
2. Analysis > Analysis >
General > Output control > Register the history
items for result checking, added from the history tab
<History result output setting>
3. Result > Special Post >
History > Check time history result using graph function
History Probes Graph allows
for customizing displayed data for both X and Y axes.
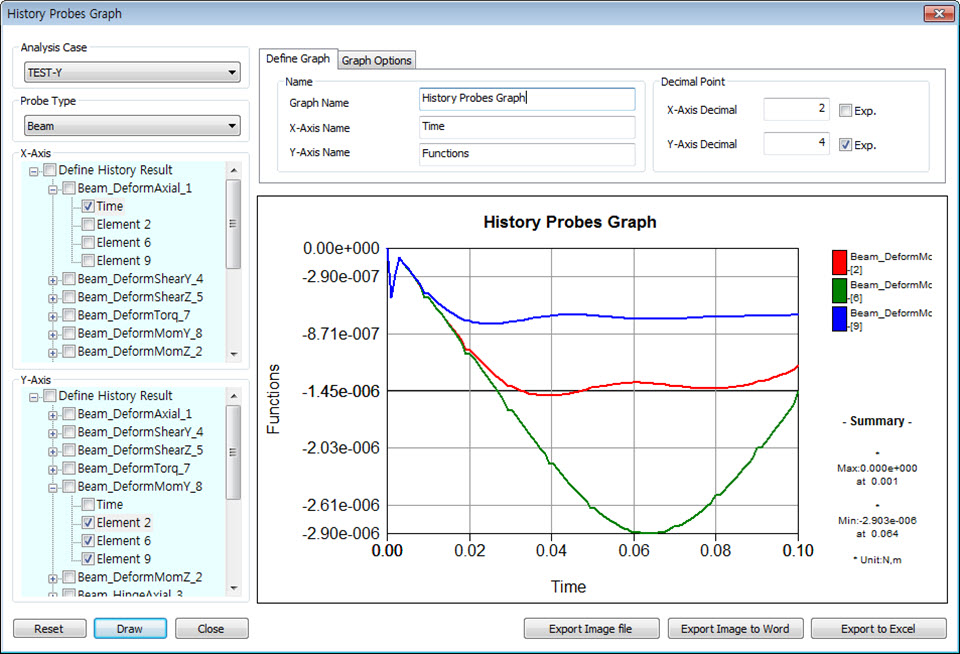
<History result search graph> |
